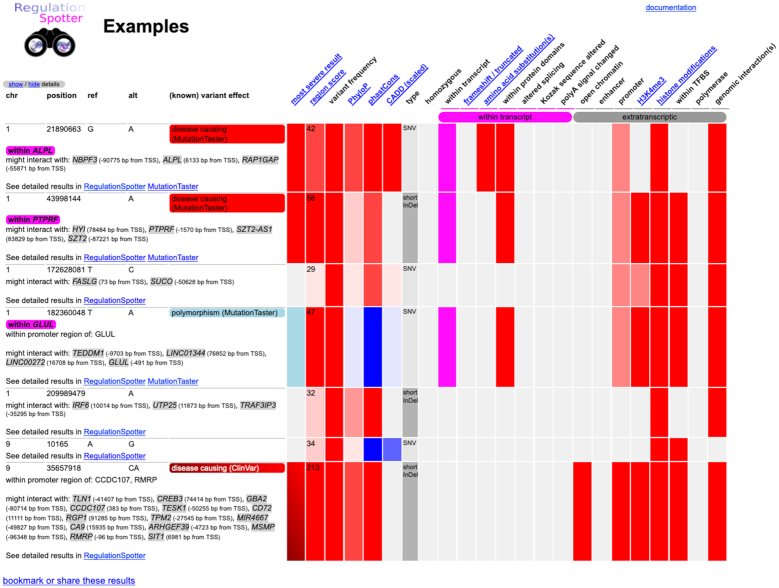
Figure 2.
Screenshot of the colour-coded results matrix. Variants chosen to be displayed are organised in a summary table (left part) and in a colour-coded matrix (right part) in order to allow the rapid overview of every variant. Users can follow hyperlinks to study every variant in further detail.

