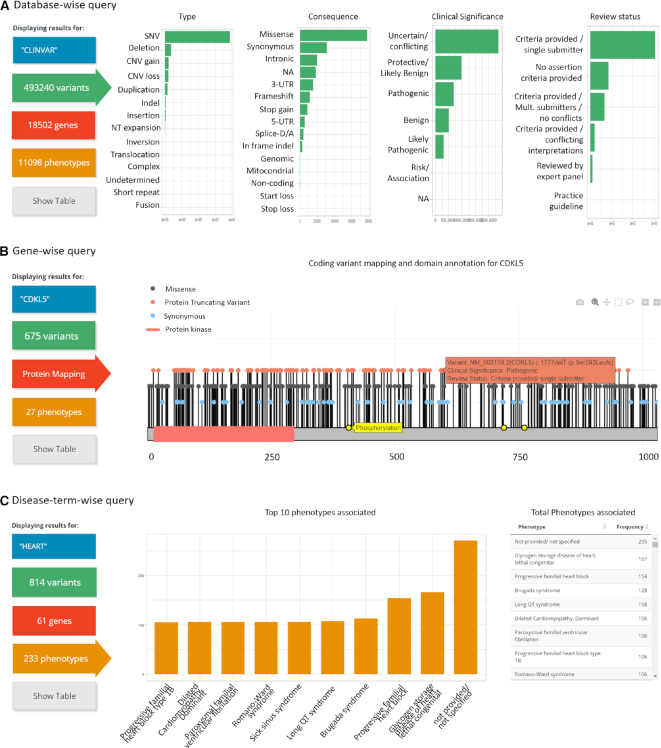
Figure 2.
Simple ClinVar results section according to the three types of input supported. Examples of Simple ClinVar outputs according to (A) Database-wise query, (B) Gene-wise query and (C) Disease-term-wise query. The user can dynamically change between variant view (green, A), gene view (red, B), phenotype view (orange, C) and the table view (gray). For gene view, variants positions are shown according to the corresponding protein sequence. Here, if the user place the cursor over a variant a tooltip will appear with summary information (orange rectangle). Genetic variants are colored in green for synonymous, gray for missense, and red for protein truncating variants (Frameshift, small indels and stops gained).

