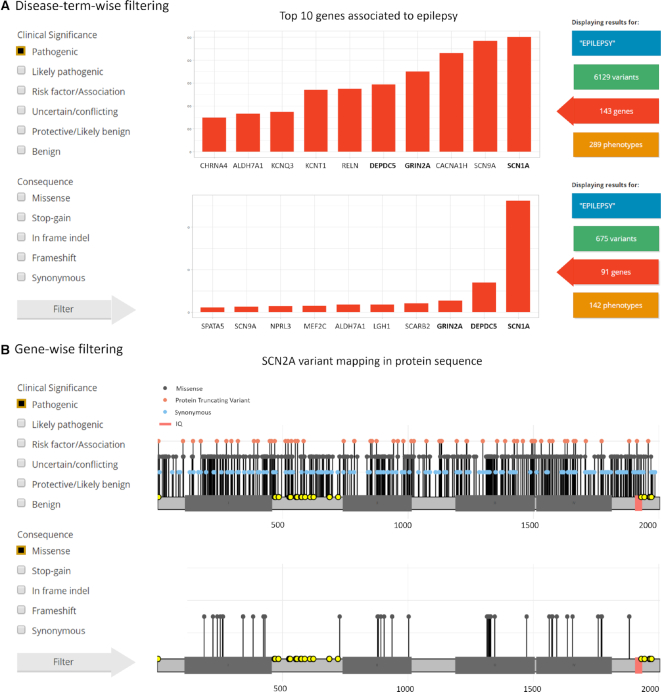
Figure 3.
Dynamic filtering examples. (A) Gene view of the Disease-term-wise query for ‘epilepsy’ shows all genes associated before (upper panel) and after (bottom panel) filtering for pathogenic variants (left panel). (B) Gene view of the gene-wise query ‘SCN2A’ shows the genetic variants mapped on the protein sequence before (upper panel) and after (bottom panel) filtering for pathogenic and missense variants (on the left).

