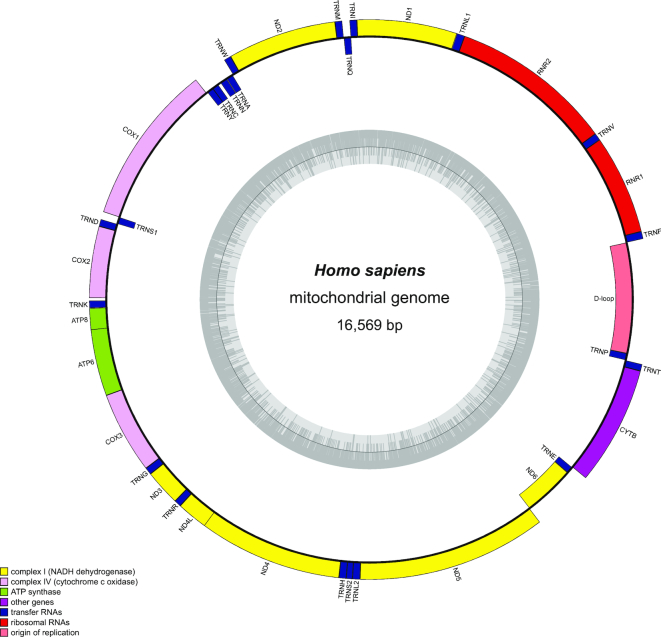
Figure 4.
OGDRAW v1.3.1 output with default parameters illustrating the human mitochondrial genome (NC_012920.1). Genes inside the circle are transcribed clockwise, genes outside the circle counter clockwise. The circle inside the GC content graph marks the 50% threshold. Note that the D-loop, spanning start and end of the submitted linear sequence, is now drawn by default.

