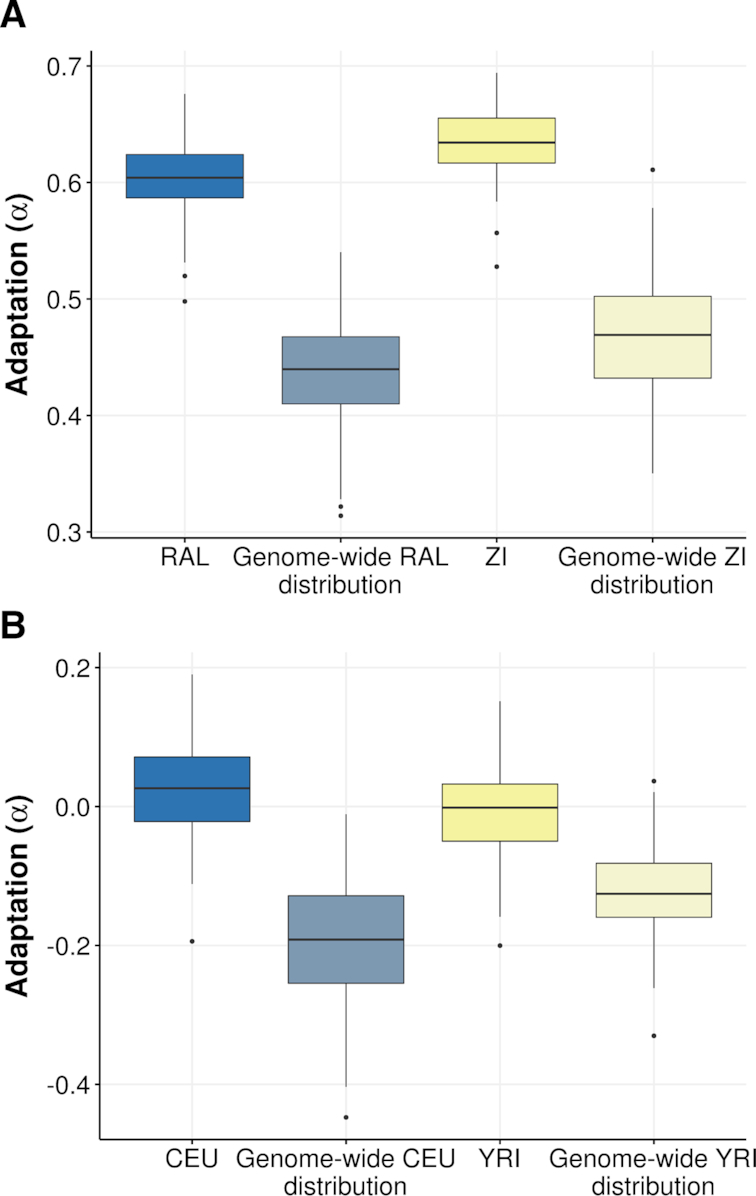
Figure 2.

iMKT graphical output of an application example. Sampling distribution of α values for protein-coding genes located in regions of high recombination (recombination rate >7 cM/Mb) compared to all protein-coding genes in the genome for (A) the D. melanogaster Raleigh (RAL) population (blue) and the D. melanogaster Zambia (ZI) population (yellow) and (B) the human Utah Residents (CEU) population (blue) and the human Yoruba (YRI) population (yellow). The distribution was calculated by randomly sampling 400 genes 100 times from the two lists of genes with replacement and estimating α in each bin. Polymorphisms with a frequency below 0.05 in the analyzed population were discarded (see main text).
