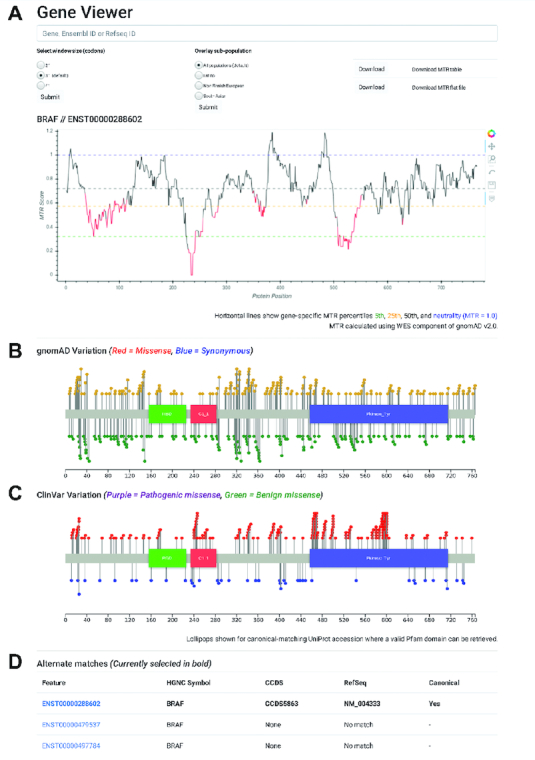
Figure 1.

MTR-Viewer gene query results page. (A) A line graph displays the MTR distribution for example gene BRAF with regions in red indicating observed variation differs significantly from neutrality. (B) Lollipop plots show the underlying gnomAD missense and synonymous variation and (C) ClinVar known pathogenic and known benign variants for the gene. (D) Alternate transcripts are displayed below with matching RefSeq transcript ID’s.
