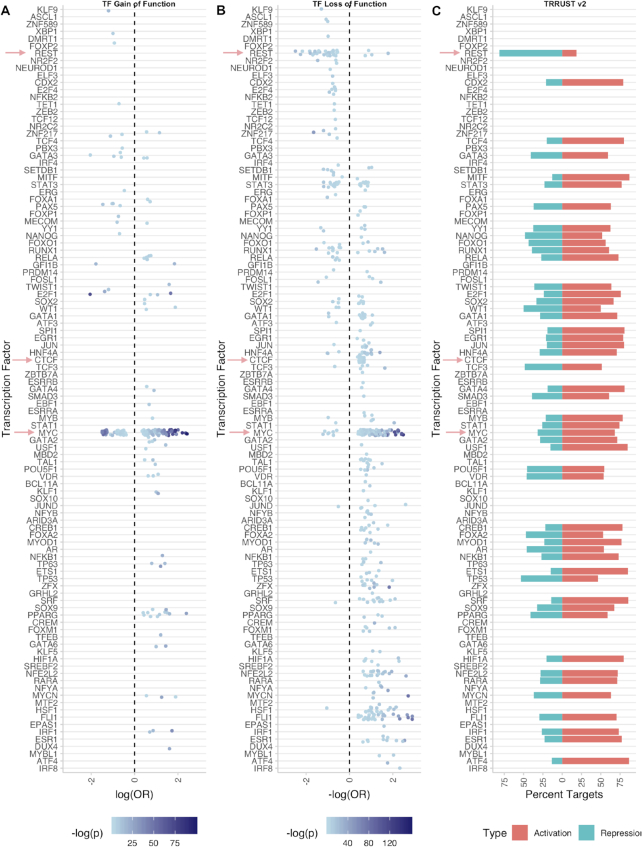
Figure 6.
Scatterplots showing activating/repressing activity across TFs. Significant ORs (P< 0.05) are plotted. For uniformity, when examining loss-of-function TF perturbations, we consider –log(OR), as this will be positive if the TF acts as an activator of its targets and negative if it acts as a repressor. Conversely, we consider log(OR) for gain-of-function perturbations, which will be positive if the TF is an activator and negative if the TF acts as a repressor. Red arrows indicate TFs discussed in the results. (A) ORs from gain-of-function TF perturbations; (B) ORs from loss-of-function TF perturbations; (C) TF–target interactions from the TRRUST v2 database. For each TF, the percent of activating TF–target interactions (red) or repressive TF–target interactions (blue) from the subset of TF–target interactions in TTRUST v2 for which directionality is available.

