
Figure 2. Oxidative Metabolism of TEMs and M2 Macrophages Promote Pyrimidine Biosynthesis from Glucose.
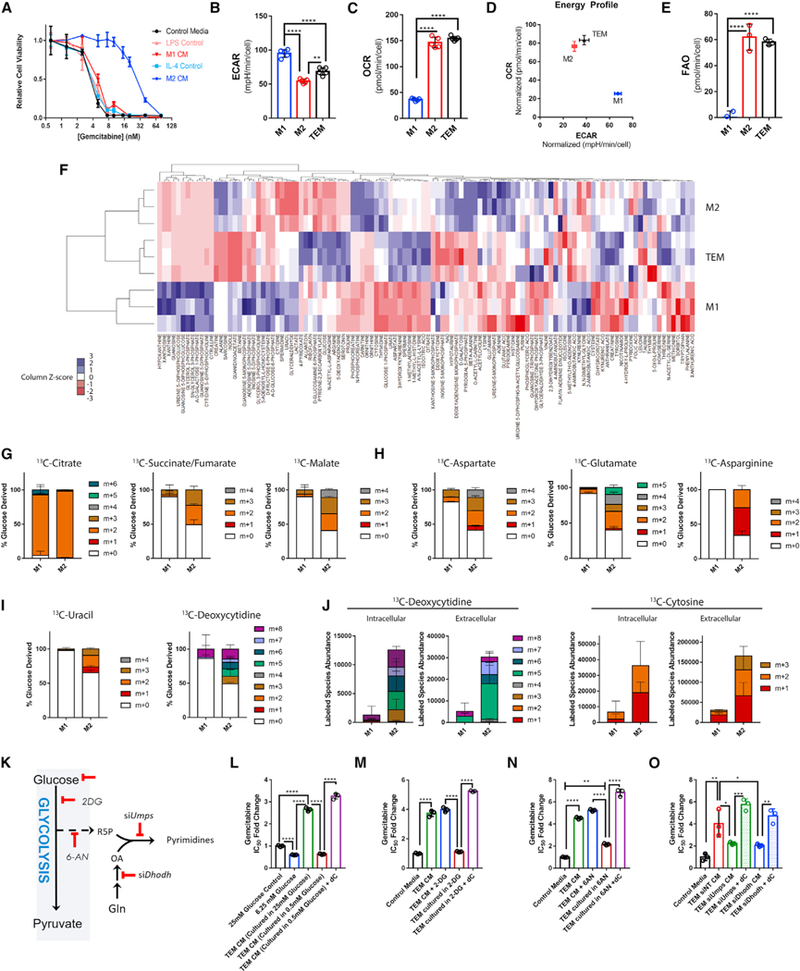
(A) Relative viability of MT3-KPC cells treated with gemcitabine (Gem) in the presence of M1 or M2 conditioned media (CM) versus control media (n = 3).
(B) Basal extracellular acidification rates (ECAR) of TEM, M1, and M2 macrophages (n = 5).
(C) Basal oxygen consumption rates (OCR) of TEM, M1, and M2 macrophages (n = 5).
(D) Comparative energy profile of TEM, M1, and M2 macrophages comparing ECAR versus OCR.
(E) Basal rate of exogenous fatty acid oxidation (FAO) of TEM, M1, and M2 macrophages (n = 5).
(F) Heatmap representation of intracellular metabolites (replicate CV < 0.4) found in TEM, M1, and M2 macrophages by metabolomics profiling (n = 3).
(G) Fractional labeling patterns from uniformly 13C-glucose of TCA cycle metabolites after 16 h in M1 versus M2 macrophages (n = 3).
(H) Fractional labeling patterns from uniformly 13C-glucose of amino acids after 16 h in M1 versus M2 macrophages (n = 3).
(I) Fractional labeling patterns from uniformly 13C-glucose of pyrimidines after 16 h in M1 versus M2 macrophages (n = 3).
(J) Intra and extracellular abundance of pyrimidine isotopologues labeled as in (G–I) (n = 3).
(K) Simplified pyrimidine biosynthesis pathway diagram. 2-DG, 2-deoxyglucose; 6-AN, 6-aminonicotinamide; Dhodh, dihydroorotate dehydrogenase; Gln, glutamine; R5P, ribose 5-phosphate; OA, Orotate; Umps, uridine 5′-monophosphate synthase.
(L) Relative Gem IC50 of KPC-MT3 cells treated in normal DMEM (25 mM), 75% glucose restricted media (6.25 mM final), 75% CM from TEMs grown in normal DMEM, 75% CM from TEMs grown in glucose restricted media, or 75% CM from TEMs grown in glucose restricted media + 3 μM dC (n = 3).
(M) RelativeGem IC50 in KPC-MT3 cells treated in DMEM, 75% TEM CM, TEM CM + 200 μM 2-DG, 75% CM from TEMs grown in 200 μM 2-DG, or 75% CM from TEMs grown in 200 μM 2-DG + 3 μMdC(n = 3).
(N) RelativeGem IC50cin KPC-MT3cellstreated in DMEM,75% TEM CM,TEM CM + 1 μM 6-AN, 75% CM from TEMs grown in 1 μM 6-AN, or75% CM from TEMs grown in 1 μM 6-AN + 3 μM dC (n = 3).
(O) Relative Gem IC50 in KPC-MT3 cells treated in normal DMEM, or 75% CM from TEMs transfected with siRNA targeting Dhodh, Umps, or nontargeting (NT) siRNA, or siDhodh, or siUmps CM + 3 μM dC (n = 3).
Error bars represent mean ± SD, *p ≤ 0.05; **p ≤ 0.01; ****p < 0.0001. See also Figures S2 and S3; Table S2.