
Figure 3.
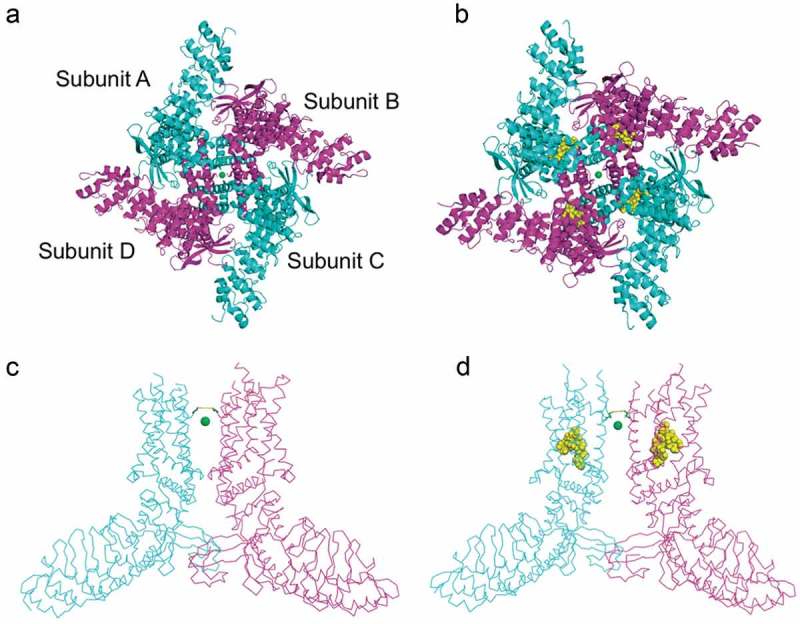
Comparison of open and closed states of TRPV2.
Extracellular views of A) a closed miTRPV2 channel (PDB 6BWM) and B) vanilloid-sensitive miTRPV2 (PDB 6BWJ) in complex with RTx shown as yellow spheres, representing the open state. On the lower panel are side views of the closed (C) and open (D) channel. Only two subunits are shown for simplicity. The green sphere is Ca2+ trapped in the pore which is notably wider in the open configuration, its also visible the rearrangement of the intracellular domain. The side chains of G604 are also depicted.