. 2019 Jul 1;8:e45976. doi: 10.7554/eLife.45976

Figure 1. Caudal fin recovers from thermal injury, while wound healing is impaired in the presence of infection.

(A) Experimental schematic and analyses. (B) Single-plane brightfield images of caudal fin area of individual wild-type larvae over time in response to simple transection or thermal injury, and in (D) the corresponding quantification of tissue regrowth area. Values are least square means and SE from three biological replicates with associated p values. Total N = 62–71 larvae per time point for each treatment. (C) Single-plane brightfield or fluorescent images of caudal fin area of individual wild-type larvae over time in response to uninfected transection or L. monocytogenes (Lm)-infected transection using mCherry-expressing L. monocytogenes, and in (E) the corresponding quantification of tissue regrowth area over time are shown. Values are arithmetic means and SE from three biological replicates, with associated p values obtained by analyzing ranks due to residuals not being normally distributed. Total N = 39–58 larvae per time point for each treatment. ***p<0.001, ****p<0.0001. Lines in lighter color depict values for every larva measured over three biological replicates. Scale bar is 100 microns.

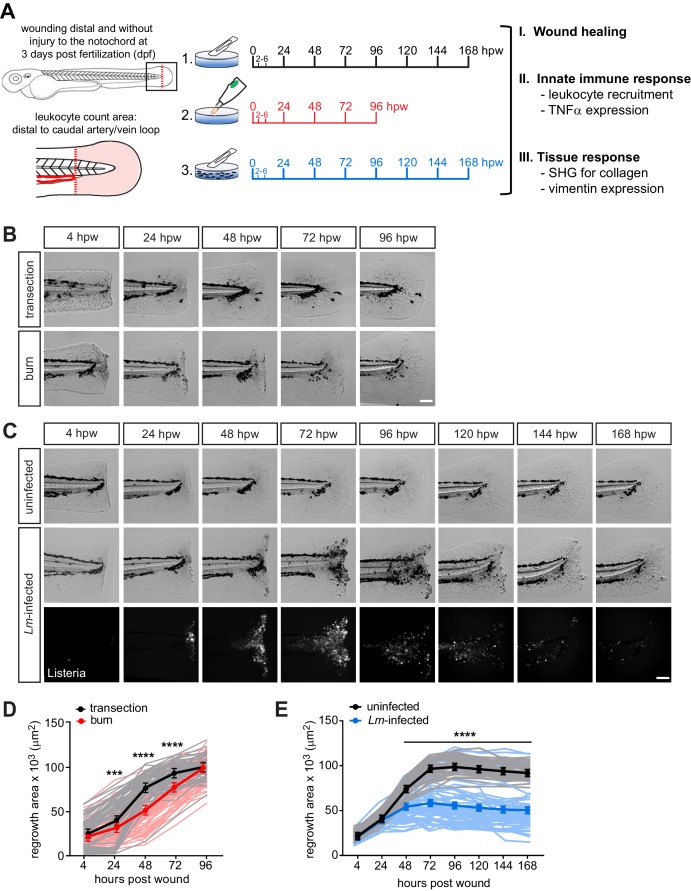
Figure 1—source data 1. Related to Figure 1D.
DOI: 10.7554/eLife.45976.004
Figure 1—source data 2. Related to Figure 1E.
DOI: 10.7554/eLife.45976.005
Figure 1—source code 1. Related to Figure 1D and E.
DOI: 10.7554/eLife.45976.006

Figure 1.

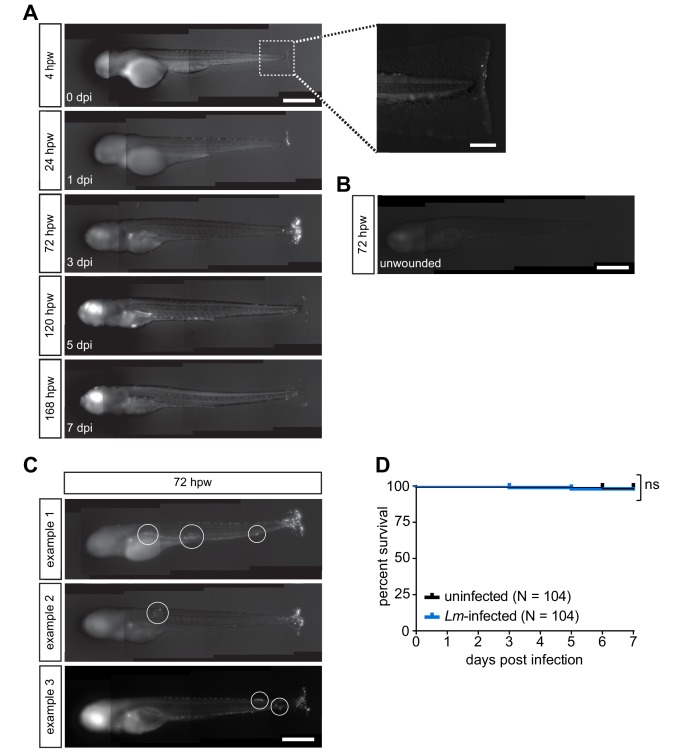
Figure 1—figure supplement 1. L. monocytogenes infection during tail wound infection is associated with minimal dissemination and negligible effect on host survival.

Figure 1—figure supplement 1.

(A) Wild-type larvae were wounded (B) or unwounded in presence of mCherry-expressing L. monocytogenes and fixed at indicated time points. 200-micron size z series at 5-micron steps was acquired using Zeiss zoomscope by tile imaging of the whole embryo. Maximal intensity projections of mCherry channel are displayed. Scale bar is 500 micron in whole embryo images, and 100 micron in the zoomed inset. Representative images are shown from three biological replicates; at least 10 embryos were imaged per time point per replicate. (C) an example where L. monocytogenes has disseminated is shown from each biological repeat. (D) Wild-type larvae were wounded in presence of unlabeled L. monocytogenes and survival was monitored. Data represents three biological replicates, where N indicates the total number of embryos pooled from the replicates. Statistical analysis was performed using R version 3.4 (www.r-project.org) as previously described (Vincent et al., 2016).