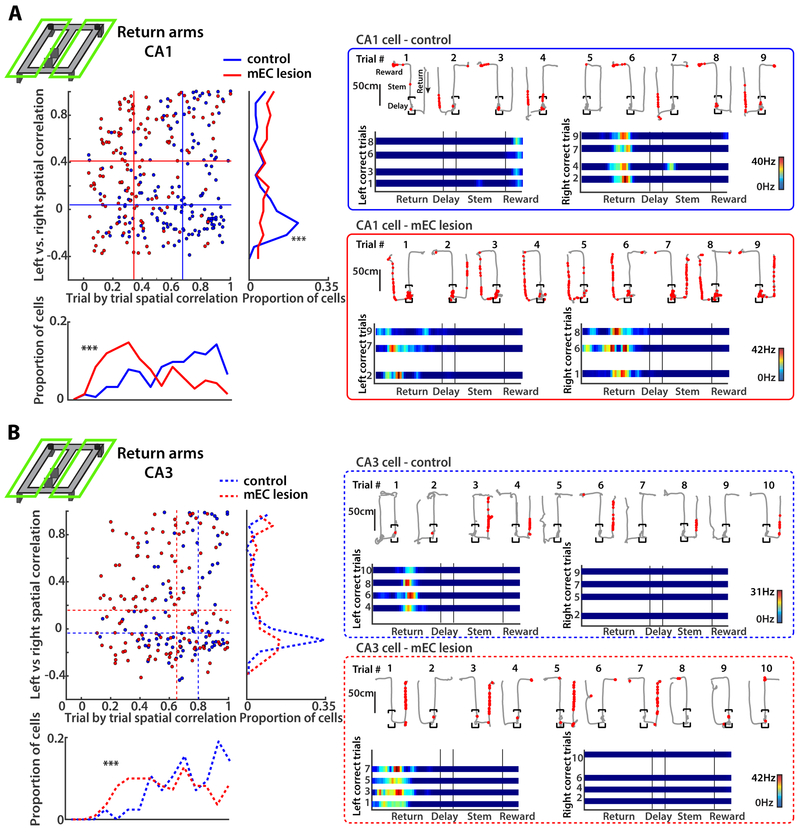
Figure 3. MEC lesions impaired spatial coding on the return arms to a larger extent in CA1 than in CA3.
(A) (Left) Spatial correlation between the average firing pattern on left compared to right maze segments (left vs. right, vertical axis) and, as a measure of place field stability, between single trials with the same turn direction (trial-by-trial, horizontal axis). Only correct trials were used for the analysis, and each dot in the scatterplot is a CA1 cell. Data for each type of spatial correlation are summarized in histograms to the right and on the bottom (*** p < 0.0001, KS test). The median values of each group (control and mEC lesion) are shown as horizontal and vertical lines within the scatterplot. (Right) Example CA1 cells from a control and an mEC-lesioned rat. Top row of each example are single correct and incorrect trials (path in grey, spike locations as red dots), and bottom row are linearized rate maps of correct left and correct right trials. Color bars indicate the firing rate (from 0 Hz in blue to the peak rate in all trials in red). (B) Same as A, but for CA3 cells. A larger number of CA3 compared to CA1 cells in mEC-lesioned rats were stable from trial to trial and discriminated between right and left maze segments. See also Figure S4.

