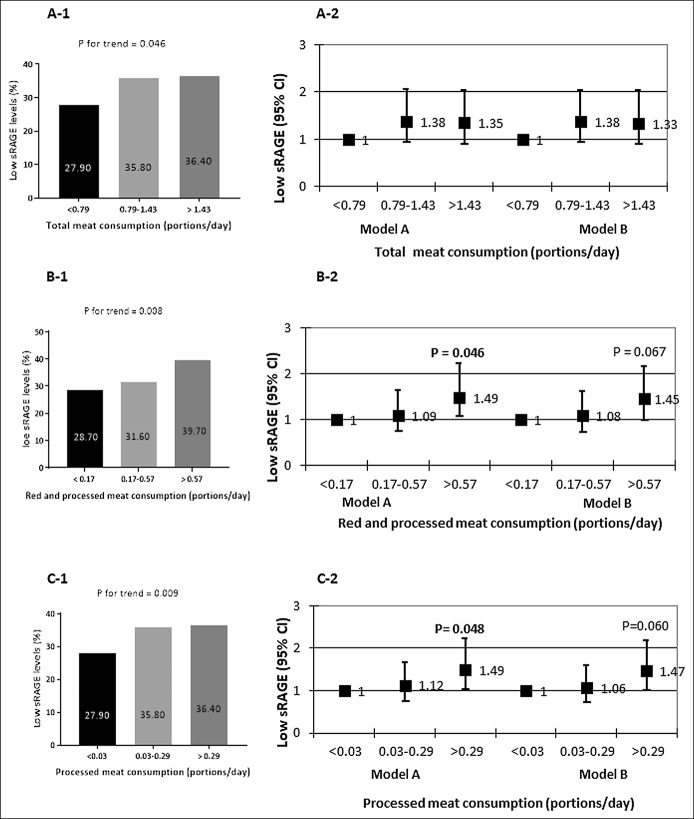
Figure 2.
Dose-response univariate and multivariate association between tertiles of total meat (a1 and a2), red and/or processed meat (b1 and b2), processed meat consumption (c1 and c2), and low sRAGE. Univariate P values are calculated by χ2 test. Multivariate OR model A adjusted for age, gender, energy intake (Kcal), and abdominal obesity (WC ≥ 102 cm for men and ≥88 cm for women); Model B additionally adjusted for working time (hr/d) and pack-years (N in each tertile; 248, 248, 247, respectively). sRAGE, soluble receptor for advanced glycation end product; OR, odds ratio; WC, waist circumference.

