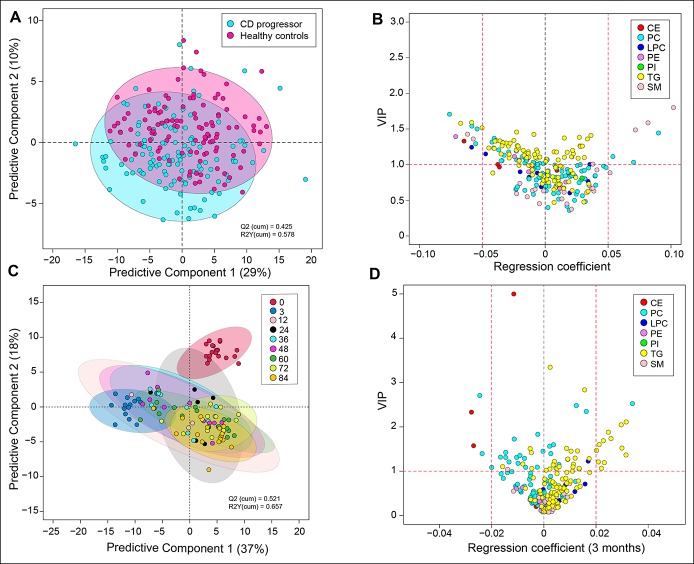
Figure 1.
Classification of CD and healthy controls, based on their lipidome. (a) PLS-DA score plot showing difference in the lipidome between CD progressors (cyan) and healthy controls (magenta). (b) A regression plot of the lipids and their VIP scores obtained from the PLS-DA model. The lipids are grouped and color coded by their classes. (c) PLS-DA score plot showing difference in the lipidome in CD progressors along the age. (d) A regression plot of the lipids and their VIP scores at age 3 months. The lipids are grouped and color coded by their classes. CD, celiac disease; PLS-DA, partial least squares discriminant analysis; VIP, variable importance in projection.

