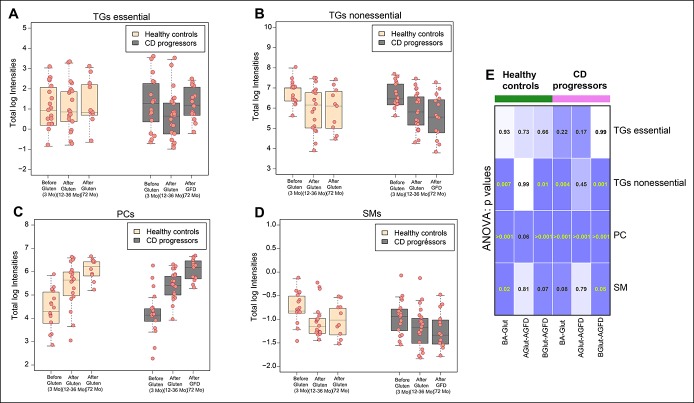
Figure 5.
Lipids that are significantly changed after gluten intake and by introduction of GFD. (a–d) Boxplots showing total log intensities of essential TGs, nonessential TGs, PCs, and SMs in the CD progressors and healthy controls before (3 months) and after introduction of gluten (12–36 months) in the diet and after introduction of GFD (72 months). (e) Grid map of P values obtained from ANOVA models by combining all possible conditions before/after the gluten intake in CD progressors and healthy controls is given. The 3 different conditions are “BA-Glut”, before and after gluten; “AGlut-AGFD”, after gluten and after gluten-free diet; and “BGlut-AGFD”, before gluten and after gluten-free diet. ANOVA, analysis of variance; CD, celiac disease; GFD, gluten-free diet; PC, phosphatidylcholine; TG, triacylglycerol; SM, sphingomyelin.

