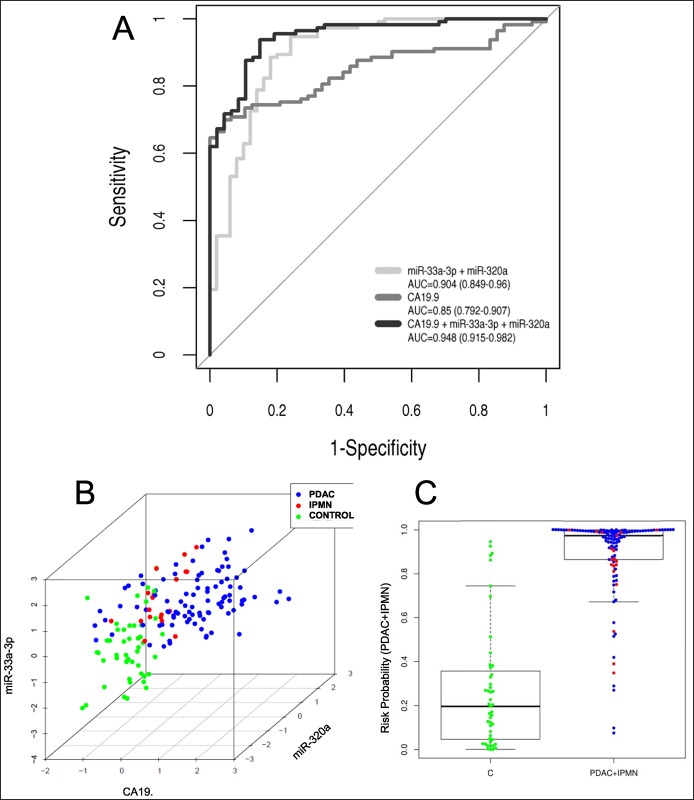
Figure 3.
Performance of the best plasma miRNA signature to discriminate between patients with pancreatic neoplasia and control individuals in our plasma set. (a) Receiver operating characteristic curve of the top miRNA signature “miR-33a-3p+miR-320a” to detect pancreatic neoplasia (PDAC or IPMN). Results are obtained from miRNA analysis by qRT-PCR in PDAC or IPMN (n = 113) and C (n = 51) plasma samples. CA19.9 diagnostic performance for patients with pancreatic neoplasia and its combination with the above-mentioned miRNA signature are also shown. (b) Scatter graph according to the scaled values of miR-33a-3p, miR-320a, and CA19.9 for PDAC, IPMN, and C plasma set (n = 182). (c) Probabilistic sensitivity analysis according to the plasma signature “miR-33a-3p+miR-320a+CA19.9.” AUC, area under the curve; C, control; IPMN, intraductal papillary mucinous neoplasm; PDAC, pancreatic ductal adenocarcinoma.

