Figure 1.
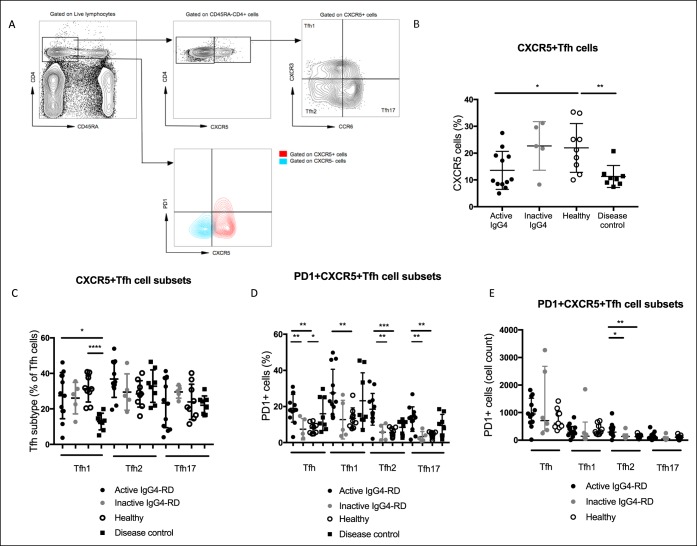
Circulating Tfh cells have an activated phenotype in IgG4-SC/AIP. Circulating Tfh-cell phenotype was analyzed by flow cytometry. (a) Contour plot showing CXCR3 and CCR6 expression on CD45RA-CD4+CXCR5+ Tfh cells from a representative donor. Three populations within the Tfh cells were identified: CXCR3+CCR6− Tfh1 cells, CXCR3−CCR6− Tfh2 cells, and CXCR3−CCR6+ Tfh17 cells. Gating for PD1 high cells shown. (b) Dot plot showing the percentage of CD4+CXCR5+ cells in active IgG4-SC/AIP, inactive IgG4-SC/AIP, disease controls with PSC, and healthy donors (HCs). (c) Dot plot showing the percentage of Tfh1, Tfh2, and Tfh17 subsets of blood Tfh cells in the 4 groups. (d) Dot plot showing the percentage of Tfh1, Tfh2, and Tfh17 cells expressing PD-1 in the 4 groups. (e) Dot plot showing absolute numbers of Tfh1, Tfh2, and Tfh17 cells expressing PD-1 in active and inactive IgG4-SC/AIP and HC groups. Median shown for all plots, Mann-Whitney and ANOVA with multiple comparisons, P values: NS P ≥ 0.05, *P < 0.05, **P < 0.01, ***P < 0.001, and ****P < 0.0001. AIP, autoimmune pancreatitis; HC, healthy control; IgG4-SC, IgG4-related sclerosing cholangitis; PD-1, programmed cell death protein 1; PSC, primary sclerosing cholangitis; Tfh, T-follicular helper.

