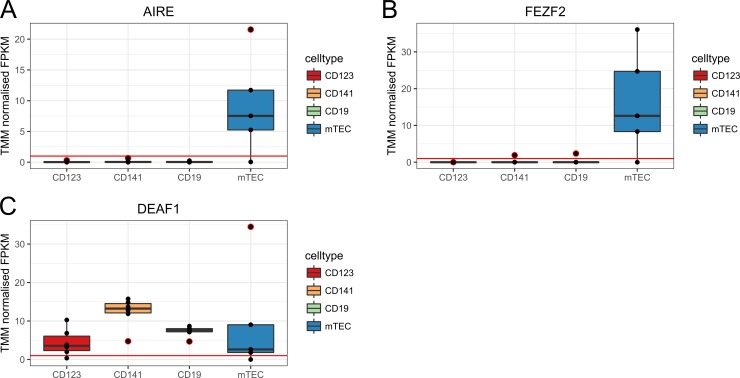
Fig 3. Expression levels of the three transcriptional regulators.
(A) AIRE (B) FEZF2 and (C) DEAF1. Boxplots represent the median and quartiles of the relative RNA expression levels as normalized FPKM. The X-axis shows the individual thymic APCs and the Y-axis shows the TMM normalized FPKM. An expression level minimum has been set at FPKM = 1 (red line). Black dots represent the individual biological replicates. Black dots encircled in red are outliers.

