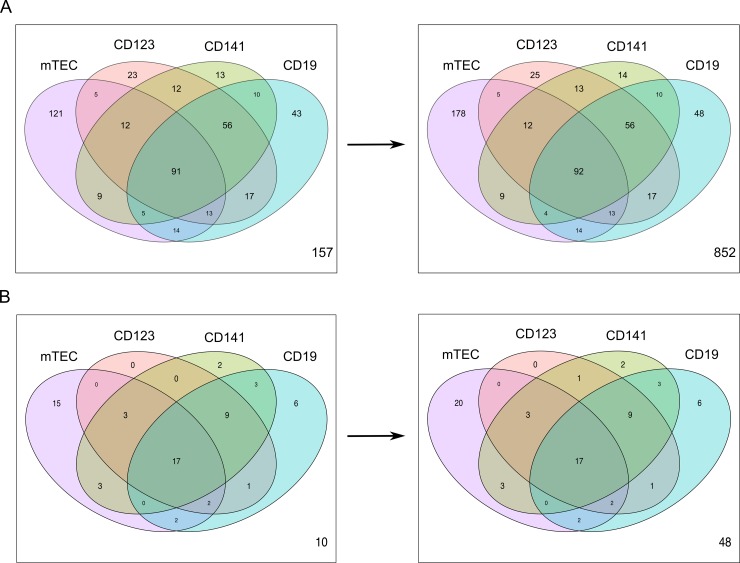
Fig 4. Uniquely and commonly expressed tissue enriched genes in the thymic APCs.
Venn diagram showing the number of expressed (FPKM > 1) (A) tissue enriched genes and (B) tissue enriched genes that overlap with genes encoding human autoantigens reported in the Immune Epitope Database. The arrow indicates that the number of biological replicates that a gene needed to be expressed in to be included in the dataset changed from five to one. The number down in the right corner displays the number of genes with expression levels FPKM < 1.

