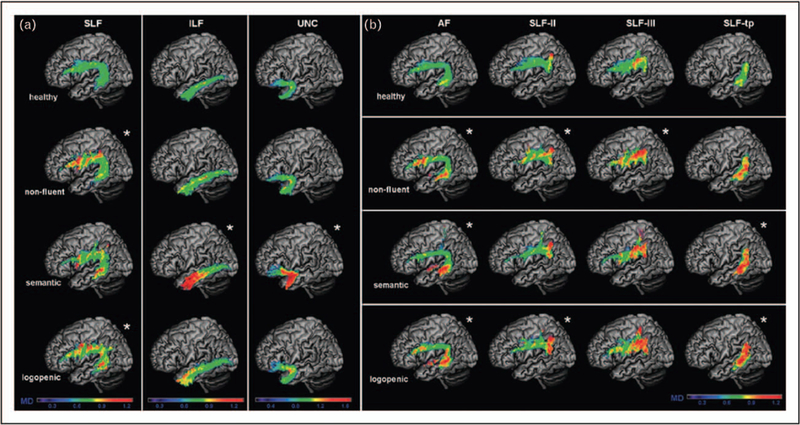
FIGURE 2.

White matter damage in the three main primary progressive aphasia variants versus controls. (a) The average mean diffusivity values for left superior longitudinal fasciculus (SLF), inferior longitudinal fasciculus (ILF), uncinate fasciculus (UNC) in all three PPA variants when compared with healthy controls on a standard MNI (Montreal Neurological Institute of McGill University Health Centre) brain template. The asterisk symbol (m) indicates statistical difference from normal controls with P value less than 0.05. The colour bar represents the average mean diffusivity values, ranging from low (violet-blue) to high values (yellow-red). Mean diffusivity is measured in 10−3 mm2 s−1. (b) The average mean diffusivity values for arcuate fasciculus (AF), frontoangular SLF (SLF-II), frontosupramarginal SLF (SLF-III), and temporoparietal SLF (SLF-tp) in all three PPA variants when compared with healthy controls on a standard MNI (Montreal Neurological Institute of McGill University Health Centre) brain template. The asterisk (m) indicates statistical difference from normal controls with P value less than 0.05. The colour bar represents the average mean diffusivity values, ranging from low (violet-blue) to high values (yellow-red). Mean diffusivity is measured in 10−3 mm2 s−1. Reproduced with permission from [21].
