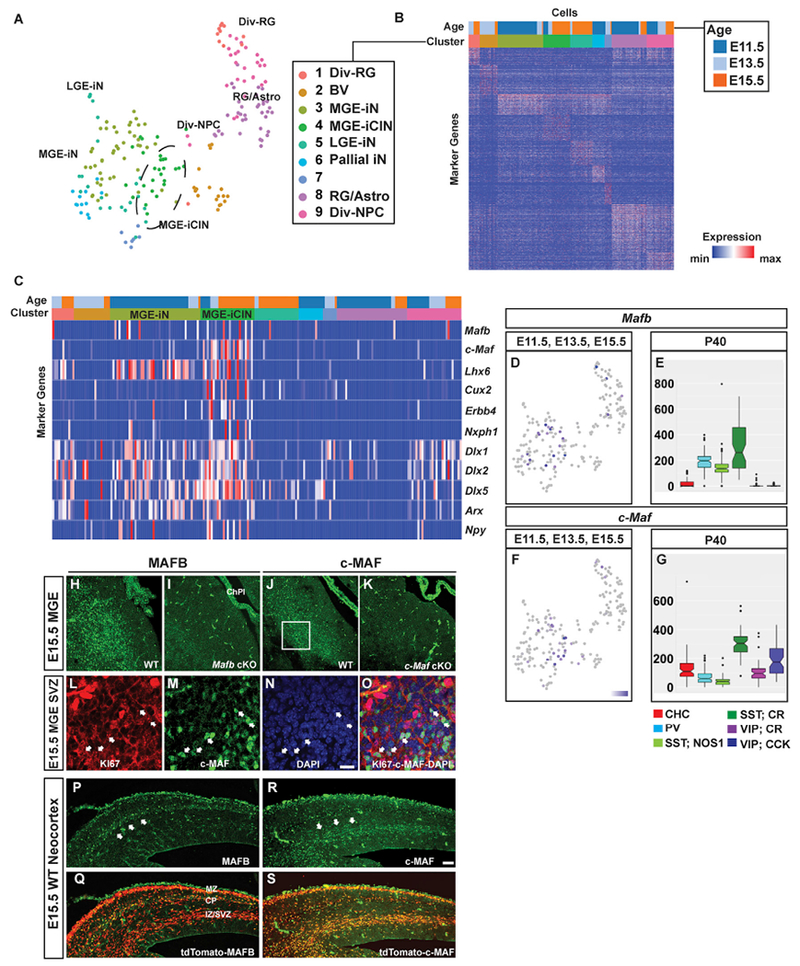
Figure 1. Analysis of Mafb and c-Maf Expression in Single Cells and in Tissue Sections from the MGE and in MGE-Derived Developing and Mature CINs.

(A–G) Single-cell RNA-seq MGE and adult CIN analyses.
(A) t-stochastic neighbor embedding (t-SNE) plot representing MGE cells analyzed from age E11.5, E13.5, and E15.5 and colored by their cluster assignments. Cells with properties of MGE-derived immature CINs (iCIN) are encircled in cluster 4.
(B) Heat map representation of cluster marker genes. Please see Table S1 for the gene list.
(C) Heat map representation of the 9 clusters; it shows enrichment of Mafb and c-Maf in cluster 4, and the expression of markers for MGE-derived CINs. Notethat half of the cluster 4 CINs co-express Mafb and c-Maf.
(D–G) Expression feature plot of Mafb (D) and c-Maf (F) in MGE cells; positive cells are blue. Box plots of Mafb (E) and c-Maf (G) expression in CIN subtypes at P40.
(H and I) Immunofluorescent images of the MGE from E15.5 WT (H) and Mafb cKO (I) showing MAFB expression.
(J and K) Immunofluorescent images of the MGE from E15.5 WT (J) and c-Maf cKO (K) showing c-MAF expression.
(L–O) Confocal imaging that shows co-labeling of KI67 (L) and c-MAF (M) in the MGE SVZ (O) (boxed in J). Arrowheads point to cells that are c-MAF+ progenitors.
(P–S) Immunofluorescent images from E15.5 WT neocortex that show Nkx2.1-cre-mediated tdTomato expression merged with MAFB (P–Q) and c-MAF (R–S). Scale barin (N) and (R) represents 100 μm. Div-RG, dividing radial glia; MGE-iN/iCIN, MGE-derived immature neurons/cortical interneurons; LGE-iN, LGE-derived immature neurons; pallial iN, pallial immature neurons; RG/Astro, radial glias and astrocytes; Div-NPC, dividing neural progenitor cells; CHC, chandelier cells; CR, calretinin; VIP, vasoactive intestinal peptide; ChPl, choroid plexus; MZ, marginal zone; CP, cortical plate; IZ/SVZ, intermediate zone-subventricular zone.
