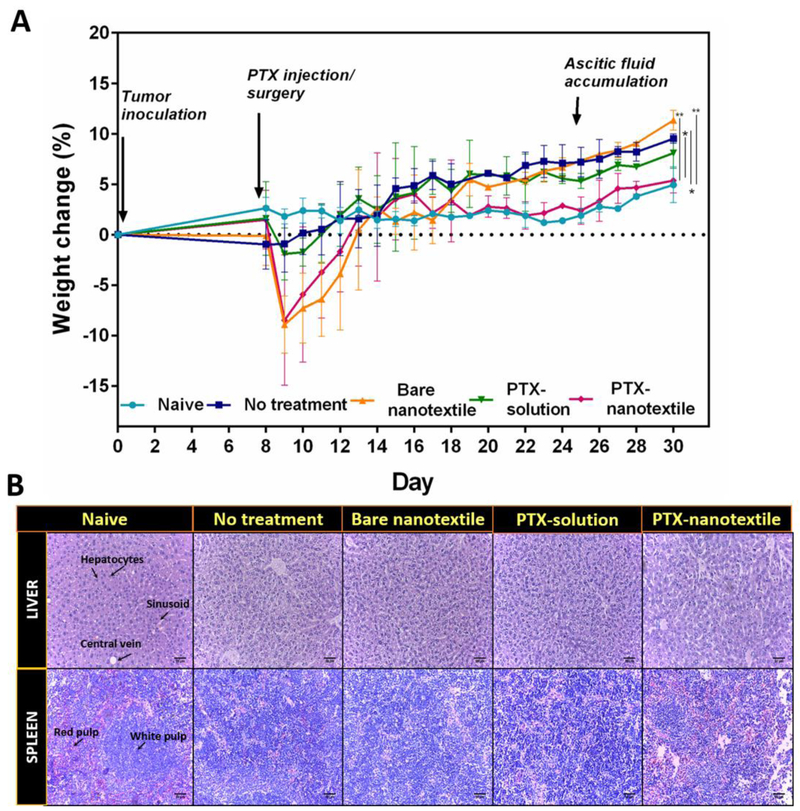
Figure 6. Body weight changes and histological evaluation of liver and spleen tissues.
(A)The animal body weight changes as a function of time. Data shown are mean±S.D. n =5 and *p < 0.05. (B) Histological (H&E stained) images of liver and spleen tissues at day 35 for the control and treatment groups. Scale bar = 50 μm.

