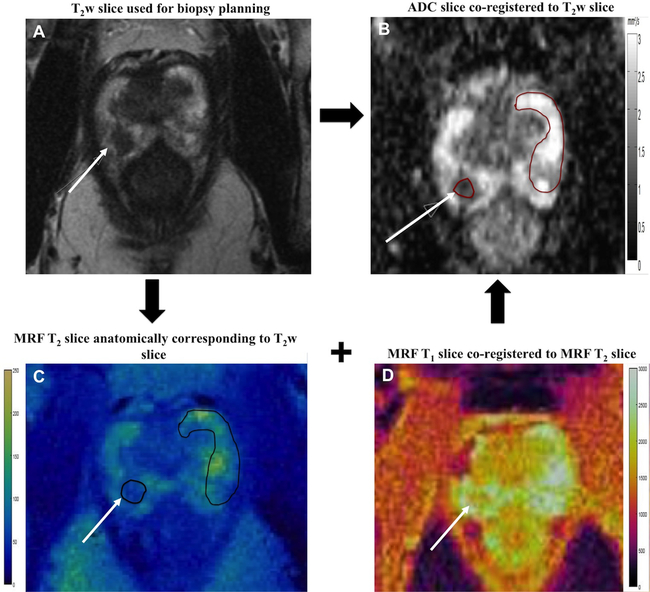
Figure 2: Regions of Interest (ROI) analysis.
Cancer suspicious lesions (solid arrow) were identified based on axial T2w slice (A) and ADC map (B). The anatomically corresponding MRF slices (C, D) were aligned with T2w slice and lesions ROIs were drawn on MRF map (black oval). As MRF maps were co-registered, both T1 and T2 values were simultaneously obtained from single MRF ROI. Independent ROIs were drawn on ADC map (red oval) co-registered to the T2w slice. ROIs were also drawn on the visually normal peripheral zone (NPZ) covering whole contralateral NPZ.

