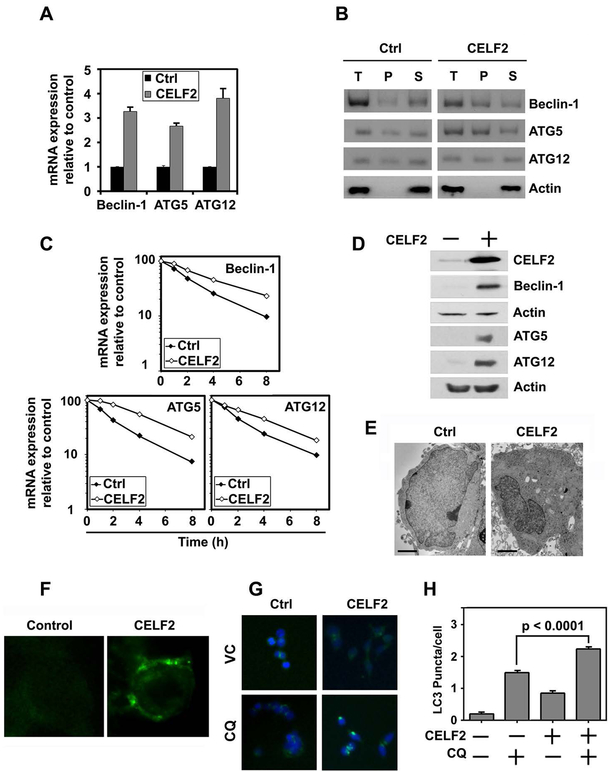
Fig. 2. CELF2 overexpression induces autophagy.
(A) CELF2 overexpression increases expression of BECN1, ATG5, and ATG12. Cumulative data of two biological repeats plated in triplicate.
(B) RNA immunoprecipitation of CELF2 overexpressing cells or vector Control (Ctrl) demonstrates direct interaction of CELF2 with BECN1, ATG5 and ATG12. T=total RNA Lysate, P=CELF2 bound precipitate, S=Supernatant.
(C) CELF2 overexpression increases stability of Beclin-1, ATG5 and ATG12 mRNA transcripts.
(D) CELF2 overexpression induces autophagy associated proteins, Beclin-1, Atg5, and Atg12, in CRC cells. Representative immunoblot demonstrating CELF2 overexpression in HCT116 cells.
(E) CELF2 overexpression induces autophagosomes. Transmission electron microscope image of CELF2 overexpressing (CELF2) HCT116 cells demonstrates increased autophagic puncta in O/E cells. Scale bars represent 2 μm.
(F) Immunofluorescence imaging of monodansyl cadeverin-labeled autophagosome vacuoles in CELF2 overexpressing HCT116 cells.
(G) LC3 puncta are induced in CELF2 overexpressing cells. Immunofluorescence (LC3 puncta are green, and nuclei stained blue with hoescht stain) in wild-type (WT) or CELF2 OE HCT116 treated with or without CQ (80 μM for 2 hours) to inhibit autophagic flux. Images taken at 200x magnification.
(H) LC3 puncta were quantified by blinded observer in at least 30 cells per group, and graphs represent cumulative results from duplicate experiments. Error bars represent ± SEM.

