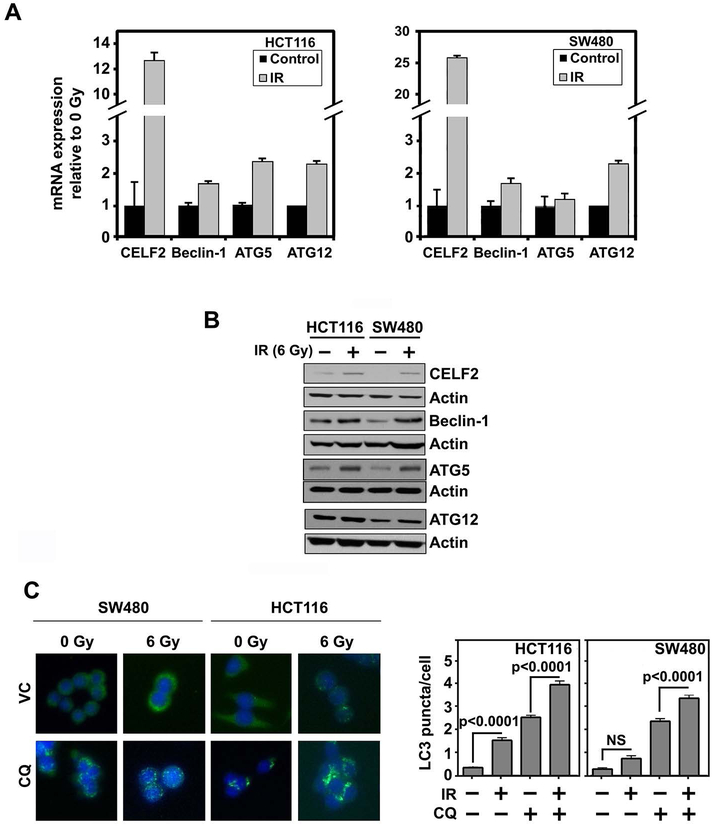
Fig. 4. IR induces CELF2 and autophagy.
(A) Expression of CELF2, Beclin-1, Atg5, and Atg12 mRNA in CRC cell lines (HCT116 and SW480) with 0 or 6 Gy IR. Graph depicts cumulative results of two biological repeats plated in triplicate.
(B) Representative immunoblot of HCT116 or SW480 with 0 or 6 Gy IR demonstrates increased expression of CELF2, Beclin-1, Atg5, and Atg12 in irradiated cells.
(C) Immunofluorescence of LC3 puncta (green) in CRC cells (nuclei stained blue with hoescht stain) treated with CQ (80 μM for 2 hours). Graphs represent cumulative results from duplicate experiments of at least 30 cells counted per group. Error bars represent ± SEM.

