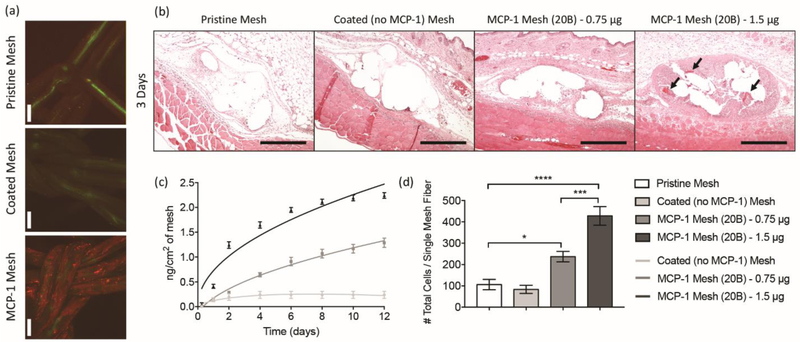
Figure 1.
[a] Confocal microscopy images of MCP-1 immunolabeled (red) polypropylene fibers (green) of pristine (i), coated [no cytokine] (ii) and MCP-1 loaded [20B] (iii) mesh. Scale bars represent 100 μm. [b] H&E stained tissue sections at 10X from mice implanted with a 1 cm2 piece of pristine, coated (no cytokine), MCP-1 (0.75 and 1.5 μg/mL in coating solutions, 20B) at 3 days post-implantation. Scale bars represent 200 μm. Arrows indicate mesh erosion. [c] Cumulative release of MCP-1 (nanograms) versus time (days) from 1 cm2 pieces of coated mesh loaded with 0.75 and 1.5 μg/mL of MCP-1 (20B). Coated (no cytokine) mesh was used as a control. Points represent the mean ± SEM. [d] Image analysis of total cells (DAPI) surrounding single mesh fibers of tissue cross sections of mice implanted with MCP-1 eluting meshes and controls, 3 days post-implantation. Bars represent the mean ± SEM. Statistical significance as (*) p < 0.05, (***) p < 0.001 and (****) p < 0.0001, using two-way ANOVA with Tukey’s tests. All other differences are non-significant.

