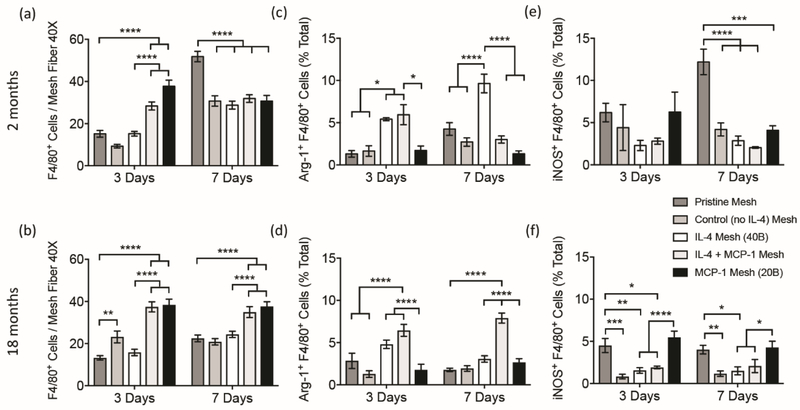
Figure 4.
Image analysis of total F4/80+ macrophages [a, b], Arg-1+ F4/80+ (M2) macrophages [c, d] and iNOS+ F4/80+ (M1) macrophages [e, f] surrounding single mesh fibers of co-immunolabelled tissue cross sections from young [a, c, e] and aged [b, d, f] mice implanted with a 1 cm2 piece of pristine, coated (no cytokine), single and sequential MCP-1 and IL-4 eluting meshes, 3 and 7 days post-implantation. Bars represent the mean ± SEM (N = 5). Statistical significance as (*) p < 0.05, (**) p < 0.01, (***) p < 0.001 and (****) p < 0.0001, using two-way ANOVA with Tukey’s (groups) and Sidak’s (days) tests. All other differences are non-significant.

