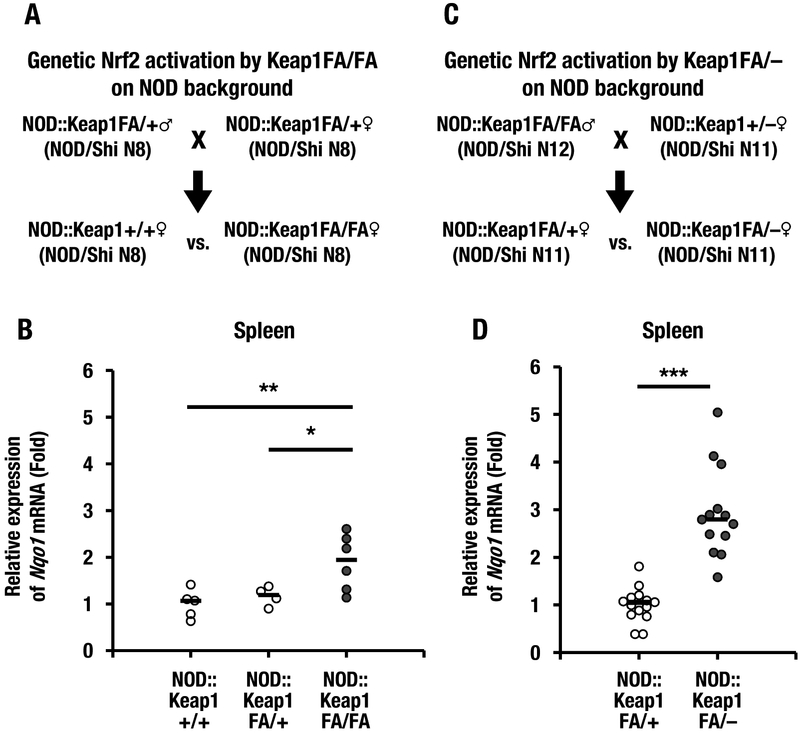
Figure 1.
A mouse model of type 1 diabetes with concomitant activation of Nrf2 signaling activation. (A) Keap1FA/+ mice were backcrossed with NOD/Shi background mice for 8 generations (N8). The mice were mated to obtain NOD::Keap1+/+, NOD::Keap1FA/+ and NOD::Keap1FA/FA genotype mice. The NOD::Keap1+/+ and NOD::Keap1FA/FA mice were examined for eight successive generations (N8) as indicated. (B) Nqo1 mRNA expression levels in the spleens of the NOD::Keap1+/+ (n=5), NOD::Keap1FA/+ (n=4) and NOD::Keap1FA/FA mice (n=6). The data were normalized to β-actin, and the expression levels in the NOD::Keap1+/+ mice were set as 1. (C) The Keap1FA/FA and Keap1+/– mice were backcrossed with NOD/Shi background mice for 12 and 11 generations (N12 and N11), respectively. The NOD::Keap1FA/FA mice and NOD::Keap1+/– mice were mated, and NOD::Keap1FA/– and NOD::Keap1FA/+ mice were generated as indicated. (D) Nqo1 mRNA expression levels in the spleens of the NOD::Keap1FA/+ (n=14) and NOD::Keap1FA/– (n=13) mice. The data were normalized to β-actin, and the expression levels in the NOD::Keap1FA/+ mice were set as 1. The bar represents the median. ANOVA followed by Fisher’s LSD post hoc test for (B) and Student’s t-test for (D) were applied. *P<0.05, **P<0.01 and ***P<0.001.

