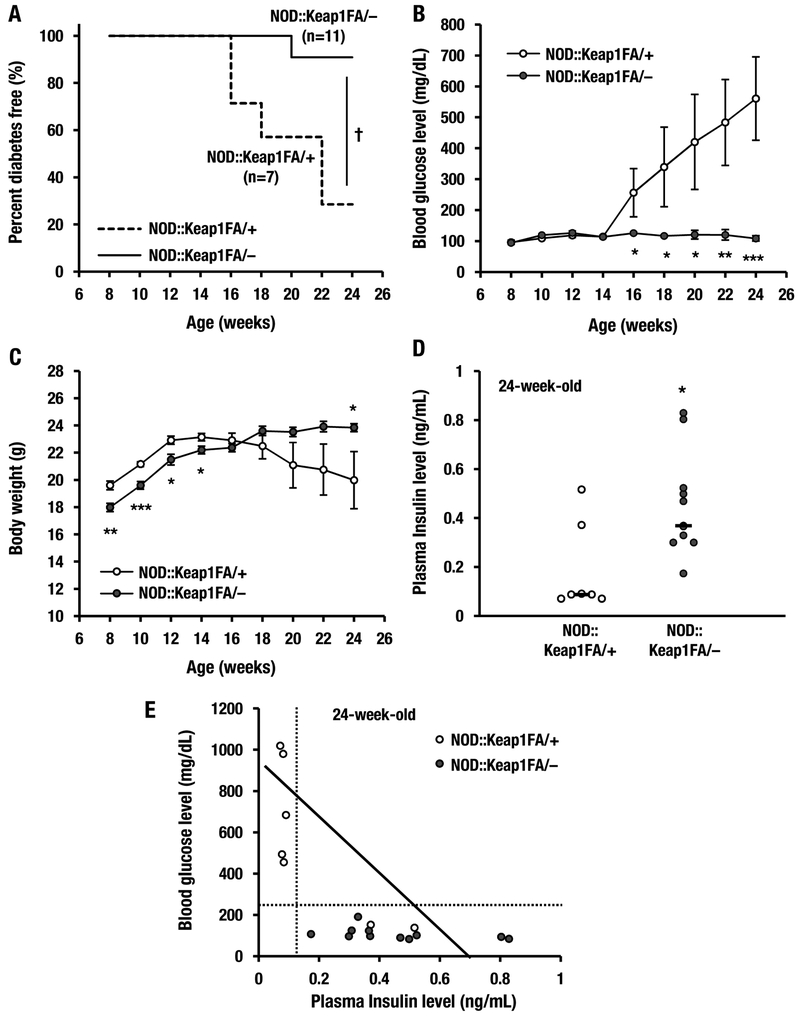
Figure 2.
Activation of Nrf2 signaling decreases the incidence of diabetes in NOD mice. (A) Kaplan-Meier survival curves showing the percentages of the NOD::Keap1FA/+ (control, n=7) and NOD::Keap1FA/– (Keap1 knockdown, n=11) mice that were diabetes-free up to 24 weeks of age. Diabetes was defined as a blood glucose level >250 mg/dL after 2 consecutive biweekly measurements. (B, C) Changes in blood glucose levels (B) and body weights (C) in the NOD::Keap1FA/+ (n=7) and NOD::Keap1FA/– (n=11) mice. The data are the mean ± SEM. (D) Plasma insulin levels in the NOD::Keap1FA/+ mice (n=7) and NOD::Keap1FA/– (n=11) at 24 weeks of age. The bar represents the median. (E) Correlation between the plasma insulin levels and blood glucose levels in the NOD::Keap1FA/+ (n=7) and NOD::Keap1FA/– (n=11) mice at 24 weeks of age. Note that high blood glucose levels (i.e., diabetic) were concentrated in the NOD::Keap1FA/+ genotype, whereas none of the NOD::Keap1FA/– mice had diabetes. Log-rank tests for the Kaplan-Meier survival curves for (A), the repeated measures ANOVA followed by Fisher’s LSD post hoc test for (B and C) and Student’s t-test for (D) were performed. †P<0.01. *P<0.05, **P<0.01 and ***P<0.001 vs. the NOD::Keap1FA/+ mice.

