Figure 3.
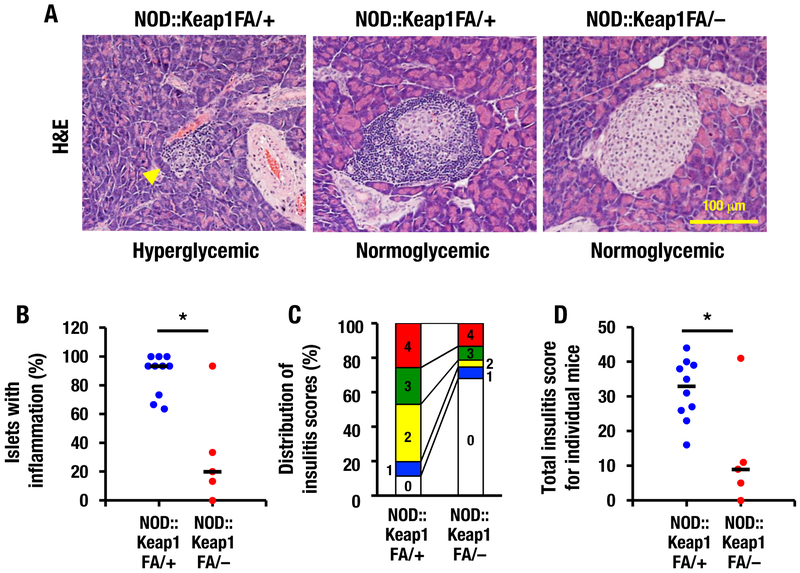
Activation of Nrf2 signaling prevents insulitis in NOD mice. (A) Representative images of pancreatic islets from hyperglycemic (blood glucose >400 mg/dL) and normoglycemic (blood glucose <150 mg/dL) NOD::Keap1FA/+ mice (left and middle panels, respectively) and normoglycemic NOD::Keap1FA/– mice (right panel) at 24 weeks of age. Bar, 100 μm. Arrowhead, extensive inflammatory cell infiltration in the islets. (B) Percentage of islets with insulitis in the NOD mice. Nine to 15 islets of each mouse were examined for percentage of insulitis in the NOD::Keap1FA/+ (n=10) and NOD::Keap1FA/– (n=5) mice, respectively. The mean value of individual mice is shown. The bar represents the median. (C) Distribution of the insulitis scores for the NOD mice. The percentages of islets with each insulitis grade were calculated using pooled values from 70 to 130 islets from the NOD::Keap1FA/+ (n=10) and NOD::Keap1FA/– (n=5) mice. (D) Total insulitis scores for individual NOD mice. Nine to 15 islets in each mouse were examined, and the 5-graded scoring scale (0, 1, 2, 3 and 4) multiplied by the islet number for each grade was summed up for each individual mouse. The mean value is shown in NOD::Keap1FA/+ (n=10) and NOD::Keap1FA/– (n=5) mice. The bar represents the median. Scoring scale: grade 0, no infiltration; grade 1, predominantly peri-islet mononuclear cell infiltration; grade 2, infiltration in 25–50% of the islets; grade 3, infiltration in 50–75% of the islets; and grade 4, infiltration in >75% of the islets. Mann-Whitney U test (B) and Student’s t-test (D) were applied. No statistical analysis was performed in (C). *P<0.05.

