Figure 4.
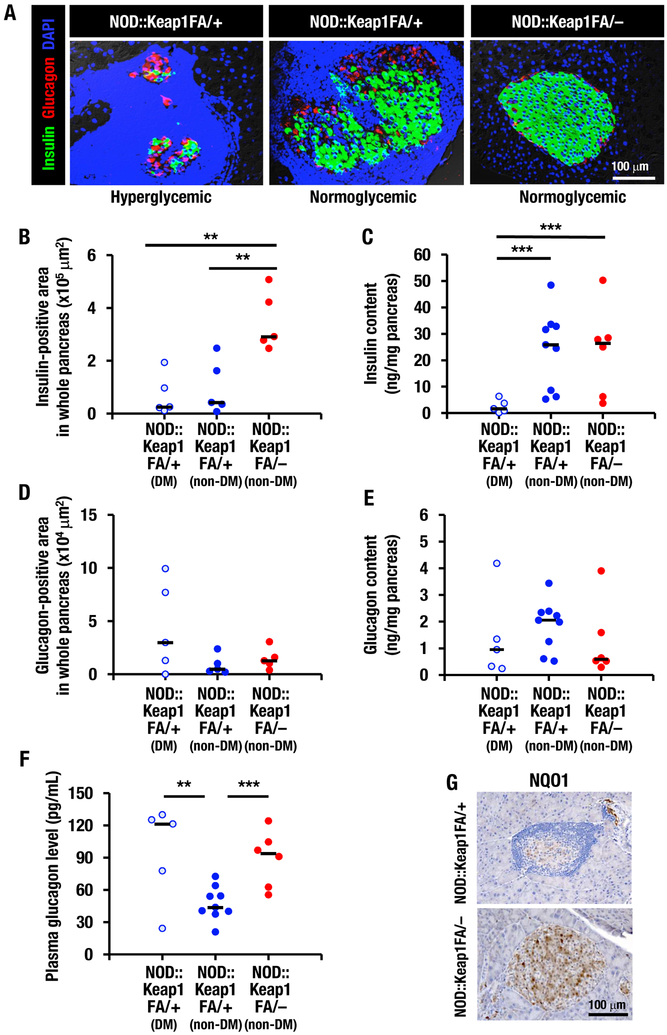
Activation of Nrf2 signaling protects insulin-positive cells in NOD mice. (A) Immunofluorescent staining for insulin (green) and glucagon (red) in islets from the hyperglycemic and normoglycemic NOD::Keap1FA/+ mice and the normoglycemic NOD::Keap1FA/– mice at 24 weeks of age (nuclei are stained with DAPI, blue). Bar, 100 μm. (B and D) Insulin-positive (B) and glucagon-positive (D) areas in the whole pancreatic sections. The diabetic (DM) and non-diabetic (non-DM) NOD::Keap1FA/+ mice and the non-DM NOD::Keap1FA/– (n=5 in each group) mice were examined at 24 weeks of age. The bar represents the median. (C, E and F) Pancreatic insulin (C) and glucagon (E) contents and plasma glucagon levels (F) in the DM and non-DM NOD::Keap1FA/+ mice and the non-DM NOD::Keap1FA/– mice (n=5, 9 and 6, respectively) mice at 15 weeks of age. The bar represents the median. (G) Immunohistochemistry for NQO1 in pancreatic sections from the NOD::Keap1FA/– and NOD::Keap1FA/+ mice. Bar, 100 μm. ANOVA followed by Fisher’s LSD post hoc test was applied. **P<0.01 and ***P<0.001.

