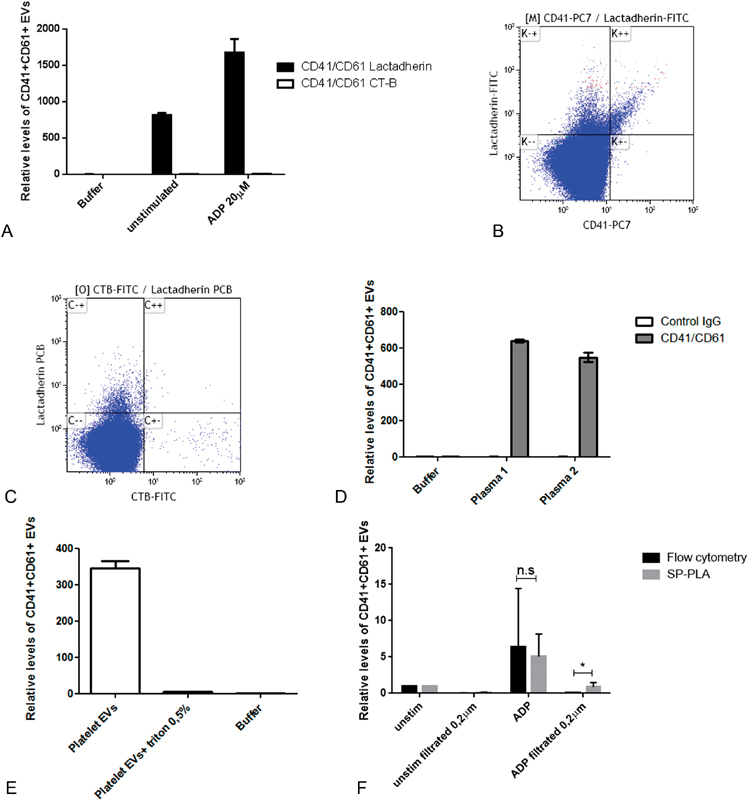
Fig. 2.

Detection of platelet-derived EVs using SP-PLA. ( A ) Detection of CD41/CD61+ EVs in plasma (diluted 1:100 in PLA buffer) using SP-PLA after lactadherin capture (black bars) and CT-B capture (white bars). Levels relative to the negative control with only PLA buffer (set to 1) are shown. Error bars represent standard deviation ( n = 2). ( B ) Plasma from ADP-stimulated whole blood was analyzed by flow cytometry using a Navios from Beckman Coulter with the gate set on 0.3–0.9 μm particles defined by polystyrene beads. One representative flow cytometry analysis (dot plot) of lactadherin-FITC and CD41-PC7–positive events is shown. ( C ) Representative flow cytometry analysis (dot plot) of CT-B-FITC and lactadherin PCB. ( D ) Mouse control IgG or CD41 and CD61 antibodies were applied in SP-PLA and signals from EVs in plasma (diluted 1:100) from two individuals are shown relative to negative control with only PLA buffer (set to 1). Error bars represent standard deviation from replicates ( n = 2). ( E ) Purified platelet EVs were lysed or not with 0.5% triton-X-100 for 5 minutes prior to SP-PLA analysis. Signal in un-lysed and triton lysed samples are shown as levels relative to negative control with only PLA buffer (set to 1). Error bars represent standard deviation from duplicates. ( F ) Whole blood was activated or not with 20 μM ADP for 2 hours and plasma was generated. The plasma samples were filtered or not with 0.2 μm filters and the levels of platelet EVs (CD41/CD61 positive) were measured with SP-PLA and high-sensitivity flow cytometry using a Navios from Beckman Coulter, with the gate set by polystyrene beads on 0.3–0.9 μm particles. Levels relative to unstimulated control are shown. Error bars represent standard deviation from three individual experiments ( n = 3).
