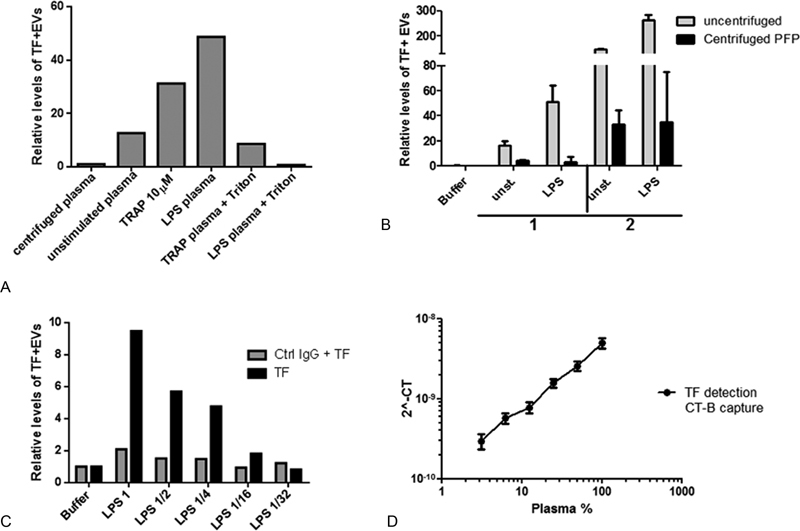
Fig. 6.

Detection of TF+ EVs using SP-PLA and CT-B capture. ( A ) The levels of TF+ EVs was measured with SP-PLA by using CT-B capture in unstimulated plasma or in plasma from TRAP or LPS-stimulated whole blood with or without triton-X100 treatment. Levels relative to EV-free plasma are shown. ( B ) The levels of TF+ EVs were measured with SP-PLA in plasma samples from unstimulated and stimulated whole blood from two individuals before (white bars) and after (black bars) centrifugation at 20.000 × g for 60 minutes. Levels relative to buffer alone are shown. Error bars represent standard deviation from technical replicates ( n = 2). ( C ) Levels of TF+ EVs were measured by SP-PLA using the TF polyclonal goat antibody conjugated to both PLA probes as usual (black bars) or by using the TF polyclonal goat IgG (conjugated to probe 1) together with a control goat IgG (conjugated to probe 2) (gray bars). The levels relative to signal in buffer alone is shown. ( D ) Levels of TF+ EVs were measured with SP-PLA using CT-B capture in plasma from LPS-stimulated whole blood, diluted 1:2 in a dilution series. The plasma concentration is plotted against linearized CT values. Error bars represent standard deviation of technical replicates ( n = 3).
