
FIGURE 2.
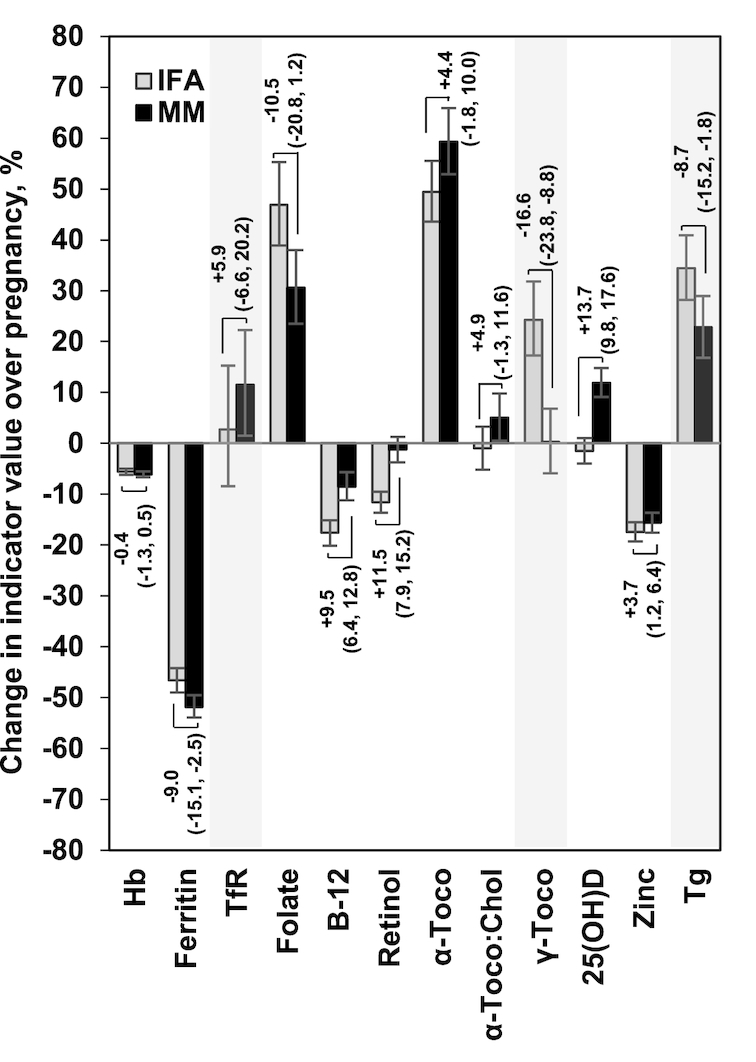
Percentage (95% CI) difference in micronutrient status indicators at 32 wk gestation in MM compared with IFA recipients (represented by brackets) in the context of pregnancy-associated changes in micronutrient status indicators expressed as percentage change (95% CI) from baseline (bars). Differences in MM versus IFA are derived from adjusted (model 2 from Table 2 using log10-transformed indicators), and percentage change over pregnancy from unadjusted, analyses. For example, there was no significant difference in Hb in late pregnancy between intervention groups (0.4% lower in MM than in IFA), while Hb was ∼6% lower in late compared to early pregnancy in both IFA and MM recipients. Ferritin was 9.0% lower among the MM than IFA recipients, and declined by 47% with IFA and 52% with MM from baseline to 32 wk gestation. Shaded indicators are those for which higher concentrations represent poorer status. Hb, hemoglobin; IFA, iron–folic acid; MM, multiple micronutrients; TfR, transferrin receptor; Tg, thyroglobulin; α-Toco, α-tocopherol; α-Toco:Chol, α-tocopherol:cholesterol ratio; γ-Toco, γ-tocopherol; 25(OH)D, 25-hydroxyvitamin D.