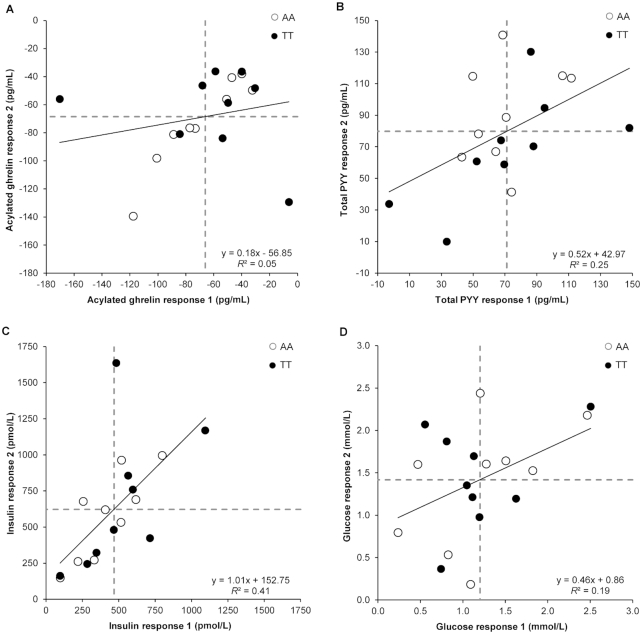
FIGURE 1.
Correlation between meal (standardized meal providing 5025 kJ) and control (no intervention) pre-to-post change scores on the 2 occasions for plasma acylated ghrelin (A), plasma total PYY (B), plasma insulin (C), and plasma glucose (D) in 18 healthy men genotyped for the rs9939609 allele of the fat mass and obesity associated (FTO) gene (n = 9 AA, n = 9 TT). “Response 1” corresponds to the first pair of conditions (meal 1 minus control 1) and “response 2” to the second pair of conditions (meal 2 minus control 2). Dashed lines represent the mean responses. PYY, peptide YY.

