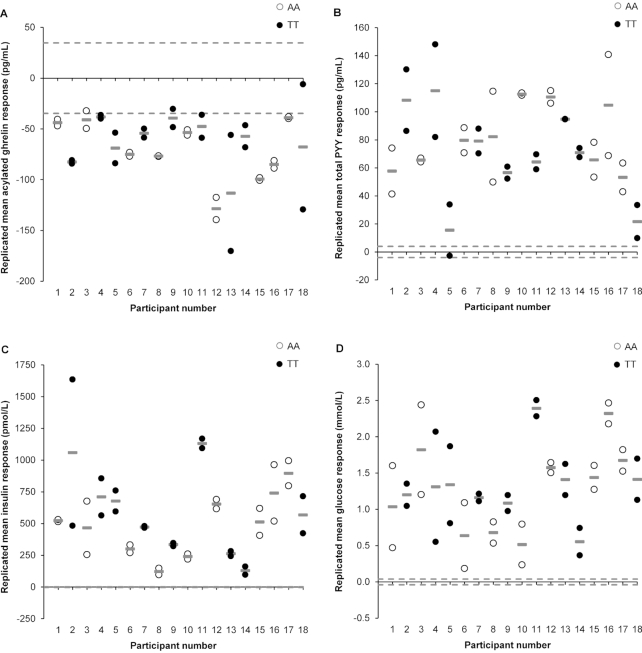
FIGURE 2.
Individual changes in hormone and glucose concentrations between the meal (standardized meal providing 5025 kJ) and control (no intervention) conditions (meal minus control): plasma acylated ghrelin (A), plasma total PYY (B), plasma insulin (C), and plasma glucose (D) in 18 healthy men genotyped for the rs9939609 allele of the fat mass and obesity associated (FTO) gene (n = 9 AA, n = 9 TT). Pre-to-post change scores for “response 1” and “response 2” are indicated by white and black circles. Gray lines (—) represent each participant's replicated mean response. Dashed lines indicate the standardized minimal clinically important difference, calculated as 0.1 × the baseline between-subject SD. PYY, peptide YY.

