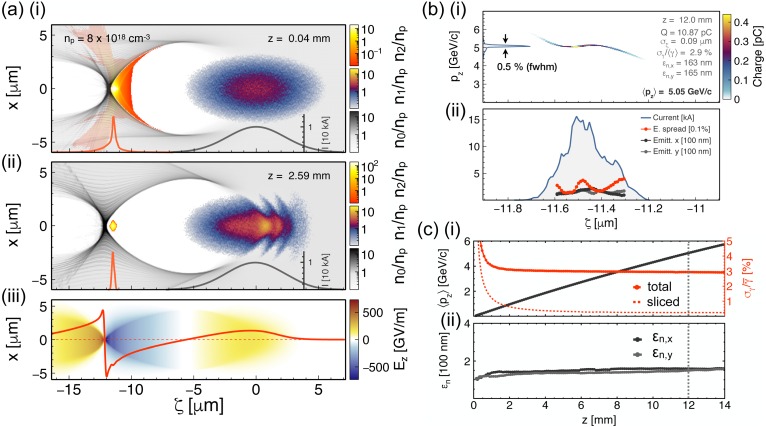
Figure 3.
Three-dimensional OSIRIS simulation for a PWFA stage with WII injection. (a(i)) Electron density on the central x–z plane of the simulation during the injection process, at z = 0.04 mm. (a(ii)) Same quantities once the dopant section has been passed, at z = 2.6 mm. The electron densities of the plasma (grey) and the He+ level (orange/yellow) are shown. The dark grey and orange lines at the bottom show the charge per unit of length of the driver and the injected electrons, respectively. (a(iii)) Longitudinal electric field, Ez, also at z = 2.6 mm. The red outline represents the on-axis values. (b(i)) Longitudinal phase space of the witness beam after 12 mm of propagation, and (b(ii)) sliced values of the current (blue), relative energy spread (red) and normalized emittance in the x (dark grey) and y (light grey) planes. (c(i)) Evolution of the average longitudinal momentum of the beam (dark grey), the total relative energy spread (red), and the average sliced relative energy spread (dashed red). (c(ii)) Evolution of the projected normalized emittance of the beam in the x (dark grey) and y (light grey) planes. (Online version in colour.)

