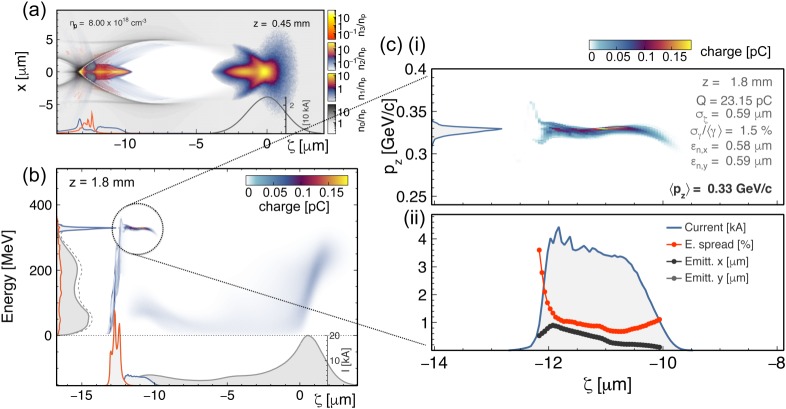
Figure 5.
Three-dimensional OSIRIS PIC simulation for the LPWFA stage in the proof-of-concept experiment at HZDR. (a) Electron density on the central x–z plane of the simulation at z = 0.45 mm, for the plasma (grey), the first (blue/yellow) and the second (orange/yellow) electronic levels of helium. The dark grey, blue and orange lines at the bottom show the charge per unit of length of the driver, electrons from the first and second level of helium, respectively. (b) Longitudinal phase space of the driver and witness beams after 1.8 mm of propagation. (c(i)) Longitudinal phase space of the witness beam after 1.8 mm of propagation, and (c(ii)) Sliced values of the current (blue), relative energy spread (red) and normalized emittance in the x (dark grey) and y (light grey) planes. (Online version in colour.)

