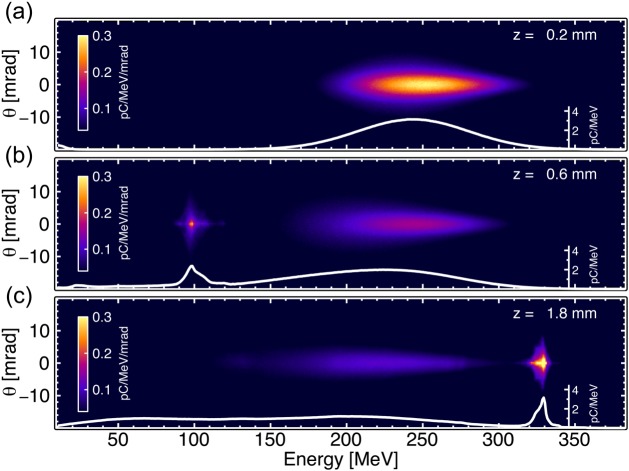
Figure 6.
Three-dimensional OSIRIS PIC simulation for the LPWFA stage in the proof-of-concept experiment at HZDR. Distribution of the driver and witness beams on the divergence versus energy plane, for three propagation distances. The white curves represent the projections on the energy axis. (Online version in colour.)

