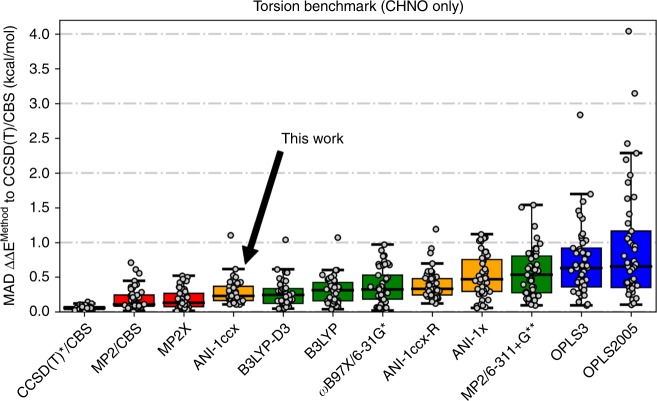
Fig. 3.
Accuracy in predicting torsional energies relevant to drug discovery. Methods compared are QM (red and green), molecular mechanics (blue), and ANI (orange) performance on 45 torsion profiles containing C, H, N, and O atomic elements. The gray dots represent the MAD of a given torsion scan vs. gold standard CCSD(T)/CBS. The box extends from the upper to lower quartile and the black horizontal line in the box is the median. The upper “whisker” extends to the last datum less than the third quartile plus 1.5 times the interquartile range while the lower “whisker” extends to the first datum greater than the first quartile minus 1.5 times the interquartile range

