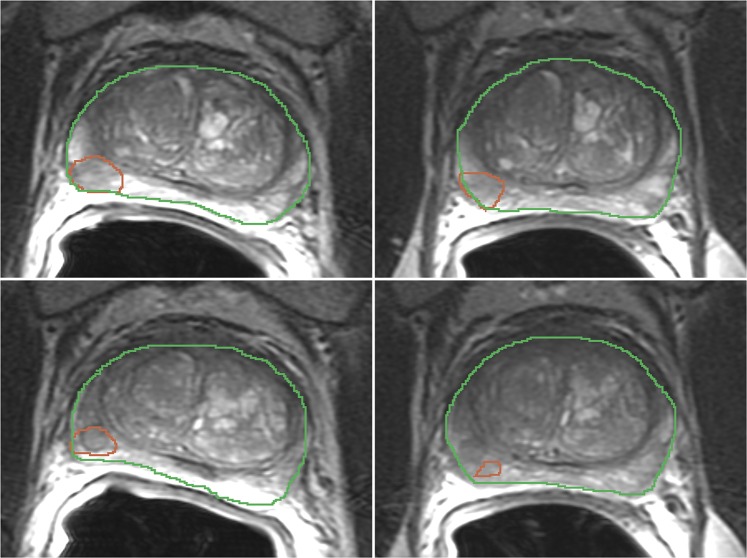
Figure 1.
Segmentation of the Tumor ROI (red) and Whole Gland (green) in T2w images for case 7 baseline (left) and follow-up (right) scans. Each slice pair was selected to match location. Top and bottom show consecutive slices going through the same tumor. The individual time points were segmented manually by the domain expert blinded to the other time point. Upon the review of the images corresponding to the time points side by side, it becomes apparent that the location of the segmented region is not consistent for the slice shown in the bottom row.

