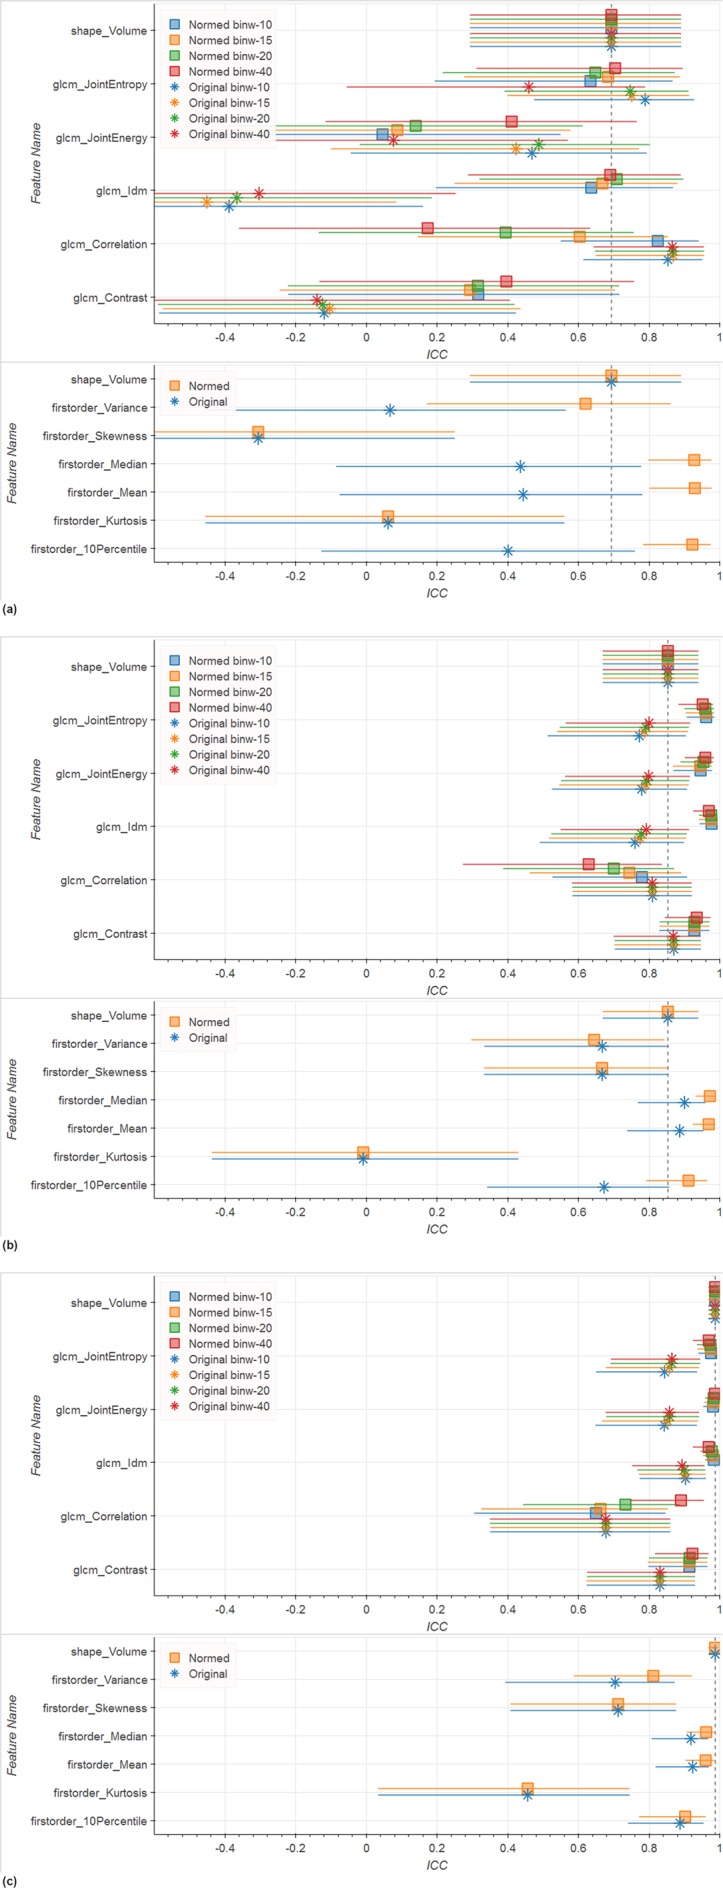
Figure 2.

ICC and corresponding 0.9 confidence interval for selected features computed on different ROIs on ADC images. Texture features are computed in 2D. Colors represent the bin width for the texture computations, glyph shape represents if the image was whole-image-normalized or not normalized. No filtering was applied to the image. The dashed line indicates the reference Volume ICC. Results show that whole-image normalization tends to improve ICCs while bin width has only marginal influence. (a) Tumor ROI (top: texture features, bottom: first order features); (b) Peripheral Zone (top: texture features, bottom: first order features); (c) Whole Gland (top: texture features, bottom: first order features).
