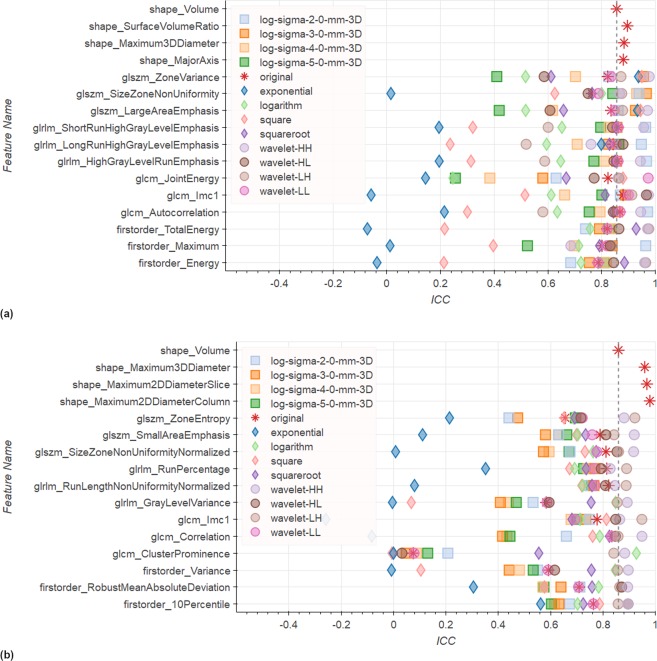
Figure 5.
Top 3 features for each feature group by ICC in T2w images for (a) the Tumor ROI and (b) the Peripheral Zone. Results in these figures illustrate that ICCs are spread over a wide range depending. Also some filters have a consistently low performance. However, no filter consistently performs above reference. We can also see that some shape filters have a higher repeatability than Volume. See Supplementary Dataset 1 for confidence intervals for the ICCs in this figure.

