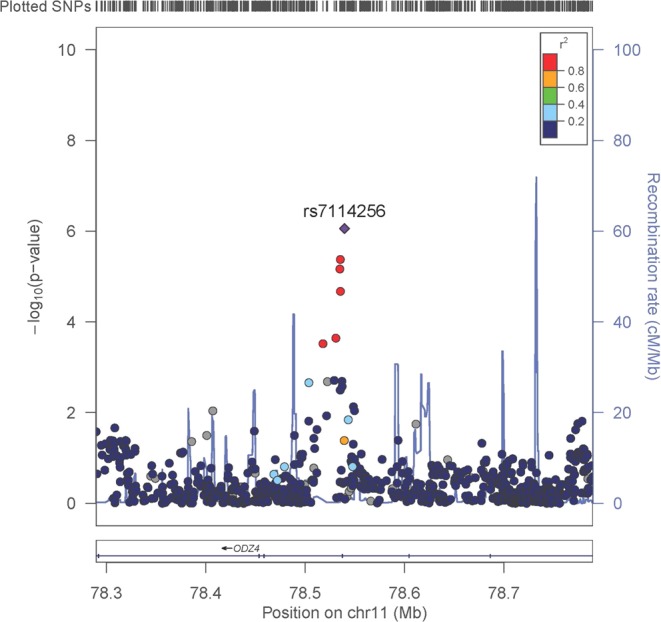
Figure 1.

Regional association plot of rs7114256. Results from 500 kb regional associations for fasting glucose change over time, centered at rs7114256. The x axis denotes genomic position build 36 and the y axis denotes the −log(P-value) and recombination rate (blue line). The purple diamond symbol represents the most-associated SNP within the region, rs7114256. The color of each symbol indicates the LD value with rs7114256 based on the HapMap2 CEU sample.
