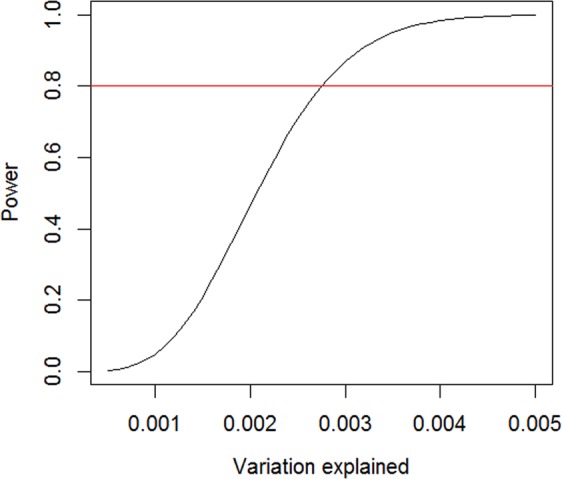
Figure 2.

Power analysis. The relationship between power and variation explained in the trait of interest by a genetic variant with a sample size of 13,807 at a significance level of 5 × 10⁻⁸. The y-axis represents the power and the x-axis the variance explained by a genetic variant. The horizontal red line represents the power of 80%. This Figure shows that we had 80% power to detect a genetic variant that explained at least 0.28% of variation in fasting glucose change over time.
