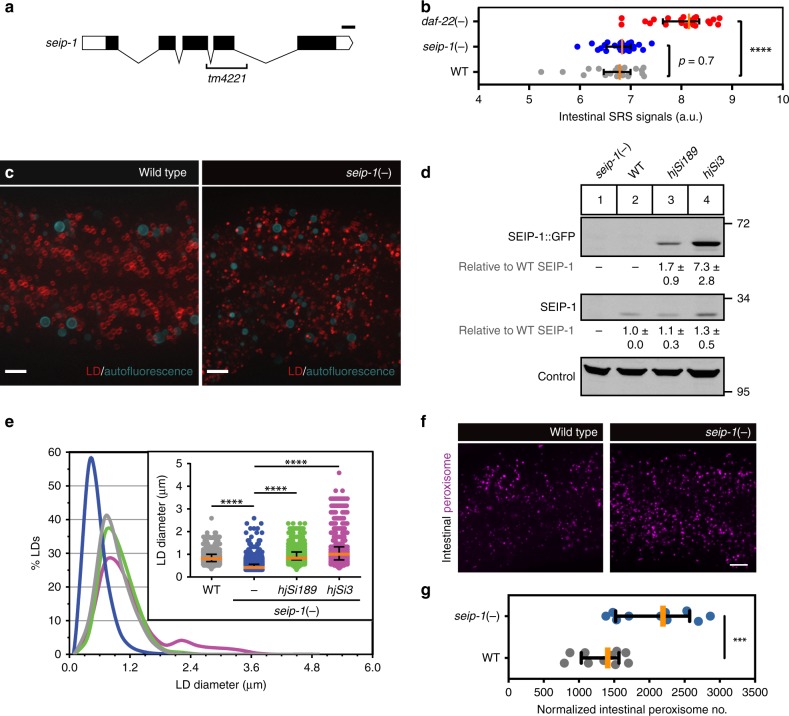
Fig. 1.
SEIP-1 regulates LD size. a Schematic representation of seip-1. Exons and untranslated regions are indicated by black and white boxes, respectively. The region deleted in the tm4221 allele is indicated. Scale bar = 100 bp. b Label-free quantification of neutral lipid content of individual animals by Stimulated Raman Scattering (SRS). Number of animals analyzed: wild type (WT) = 22, daf-22(−) = 22, seip-1(−) = 24. c Visualization of LDs using mRuby::DGAT-2 (hjSi112) in a WT or seip-1 (tm4221) mutant larval L4 stage animal. mRuby is in red and autofluorescence from lysosome-related organelles (LROs) is pseudocolored cyan. A projection of 7.5 μm z stack centering at the second intestinal segment is shown. d The expression levels of SEIP-1::GFP and endogenous SEIP-1 were determined by SDS-PAGE and immunoblotting with anti-SEIP-1 antibodies. A non-specific band at ~95 kDa served as a loading control. The expression level of endogenous SEIP-1 in WT animals served as a reference for normalization of signals in other samples. Mean ± SD is presented from three independent experiments. e Frequency distribution of LD diameter. The curve was fitted twice using Fit Spline/LOWESS (20 points in smoothing window, 4000 segments) method based on a histogram with a bin size of 0.3 μm (see Supplementary Fig. 1d, applicable to all subsequent frequency distribution curves). Inset: a scatter plot summarizing LD diameter. Total number of LDs measured: WT = 1680, seip-1 (tm4221) = 3934, hjSi189;seip-1 (tm4221) = 2224, and hjSi3;seip-1 (tm4221) = 1209. f Visualization of intestinal peroxisomes in a WT or seip-1 (tm4221) larval L4 stage animal. Signals from tagRFP::DAF-22 peroxisomal thiolase were pseudocolored magenta. A projection of 6.5 μm z stack centering at the second intestinal segment is shown. g The total number of intestinal peroxisomes in a normalized volume of 80 × 80 × 6.5 μm (xyz). n = 10 animals. For all fluorescence images, scale bar = 5 μm. For all scatter plots, median with interquartile range is displayed. For all statistics, *p < 0.05, **p < 0.01, ***p < 0.001; ****p < 0.0001 (unpaired t-test), which applies to all subsequent statistical analysis

