Fig. 4.
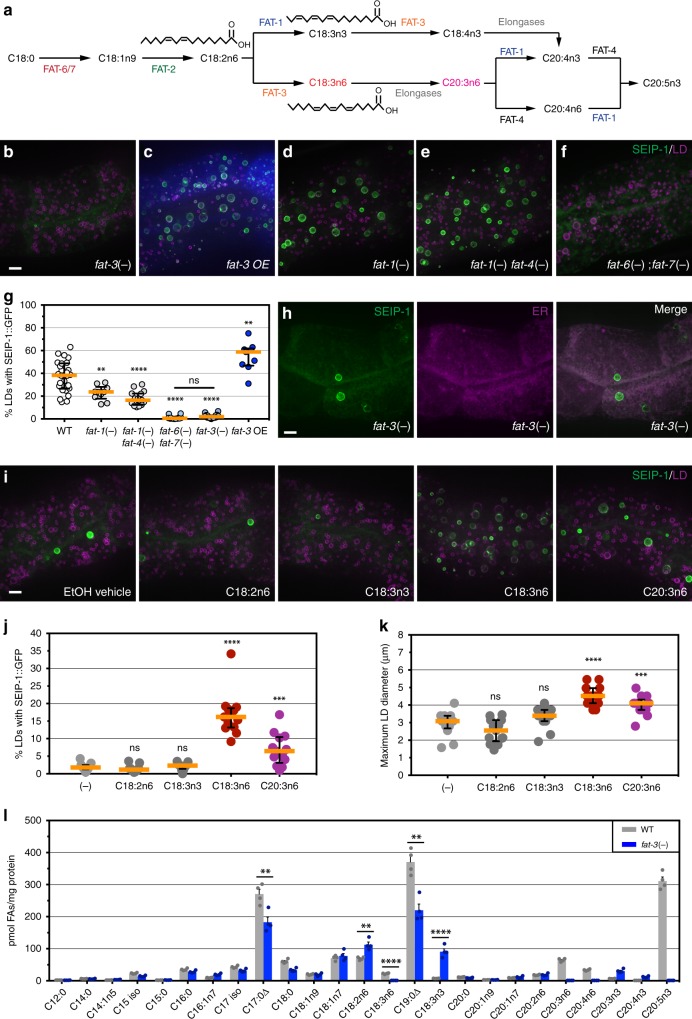
Mislocalization of SEIP-1::GFP in fat-3 mutant animals. a The biosynthetic pathway for polyunsaturated fatty acids in C. elegans. b Visualization of SEIP-1::GFP (hjSi3) in a fat-3 (ok1126) mutant larval L4 stage animal. A projection of 4.5 μm z stack centering at the second intestinal segment is shown. The LD marker mRuby::DGAT-2 (hjSi112) was used and the mRuby signal is pseudocolored magenta. c As in (b), but with a WT animal carrying a transgene that overexpressed FAT-3 (Ex[fat-3p::fat-3 genomic DNA::SL2::tagBFP]). The presence of blue fluorescence indicates the overexpression of FAT-3. d–f As in (b), but in fat-1(wa9), fat-1(wa9) fat-4(wa14), or fat-6(tm331);fat-7(wa36) mutant background. g A scatter plot summarizing the percentage of LDs associated with SEIP-1::GFP. Number of animals analyzed: WT = 26, fat-3(−) = 18, fat-1(−) = 10, fat-1(−) fat-4(−) = 15, fat-6(−);fat-7(−) = 12, Ex[fat-3(+)] = 9. h As in (b), but with a luminal ER mCherry marker (hjSi158) in a fat-3 (ok1126) mutant animal. The mCherry signal is pseudocolored magenta. i Visualization of SEIP-1::GFP (hjSi3) and mRuby::DGAT-2 (hjSi112) in a fat-3(ok1126) mutant larval L4 stage animals grown in the presence of EtOH vehicle, linoleic acid (LA, C18:2n6), α-linolenic acid (ALA, C18:3n3), γ-linolenic acid (GLA, C18:3n6) or dihomo-γ-linolenic acid (DGLA, C20:3n6) supplementation. A projection of 4.5 μm z stack centering at the second intestinal segment is shown. j The effects of PUFAs supplementation on the percentage of LDs associated with SEIP-1::GFP. Number of animals analyzed: (−) = 13, C18:2n6 = 13, C18:3n3 = 14, C18:3n6 = 13, C20:3n6 = 13 (also applied to (k)). k As in (j), but the effects of PUFAs supplementation on the maximum LD diameter is shown. l The abundance of all fatty acids detected in WT or fat-3 (ok1126) larval L4 stage animals. Mean ± SEM from four independent samples is shown. For all fluorescent images, scale bar = 5 μm. For all scatter plots, median with interquartile range is displayed

