Fig. 7.
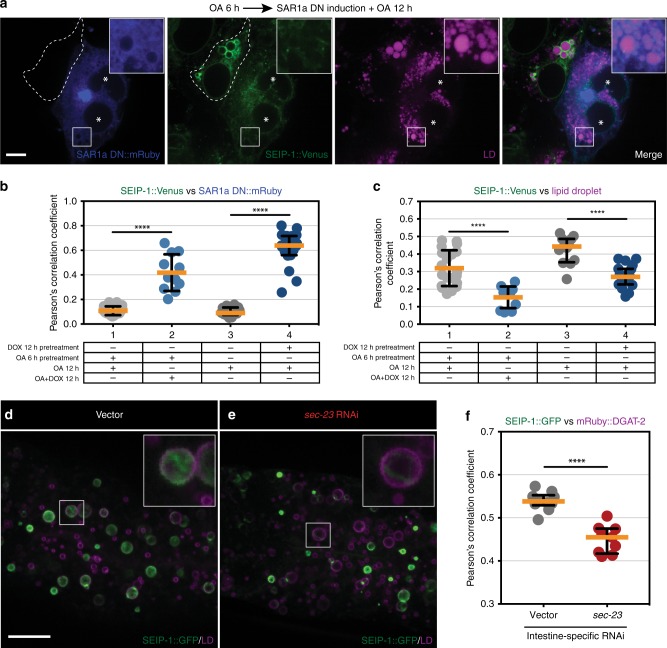
Inhibition of COPII perturbs the proper targeting of SEIP-1. a Doxycycline (DOX)-inducible overexpression of SAR1a(H79G)::mRuby (dominant-negative (DN) mutant) in COS7 cells that stably expressed SEIP-1::Venus. Cells were pre-loaded with 400 μM oleic acid (OA) for 6 h and induced by 1 μg/mL DOX for 12 h in the presence of OA. Lipid droplets were stained by FAS and pseudocolored magenta, mRuby signal is pseudocolored blue. Boxed regions were magnified 3× and shown in the inset. Single focal planes are shown. Asterisks mark the cells that overexpressed SAR1a DN mutant, while the adjacent cells with relatively low level of induction are outlined by dashed lines. Scale bar = 10 μm. b Colocalization coefficient of SAR1a DN::mRuby and SEIP-1::Venus signals, calculated from 4.5 μm z-stack volumes. Number of cells analyzed: column 1 = 20, column 2 = 11, column 3 = 12, column 4 = 19 (also applied to (c)). Columns 1 and 3 serve as controls to columns 2 and 4, respectively. Images in (a) were quantified and summarized in column 2; images in Supplementary Fig. 7b were quantified and summarized in column 4. c As in (b), but with the colocalization coefficient of SEIP-1::Venus and FAS (LD dye) signals calculated. d Visualization of SEIP-1::GFP (hjSi3) with control RNAi knockdown in a larval L4 stage animal. A LD marker mRuby::DGAT-2 (hjSi112) was used and the mRuby signal is pseudocolored magenta. Projections of 4.5 μm z stack centering at the second intestinal segment are shown. The boxed region is magnified 3× and shown in the inset. Scale bar = 10 μm. e As in (d), but with intestine-specific RNAi knockdown of sec-23. f Colocalization coefficient of SEIP-1::GFP and mRuby::DGAT-2 signals calculated from 4.5 μm z-stacked volumes in the second intestinal segment. Number of animals analyzed: vector = 10, sec-23 = 9. For all scatter plots, median with interquartile range is displayed

