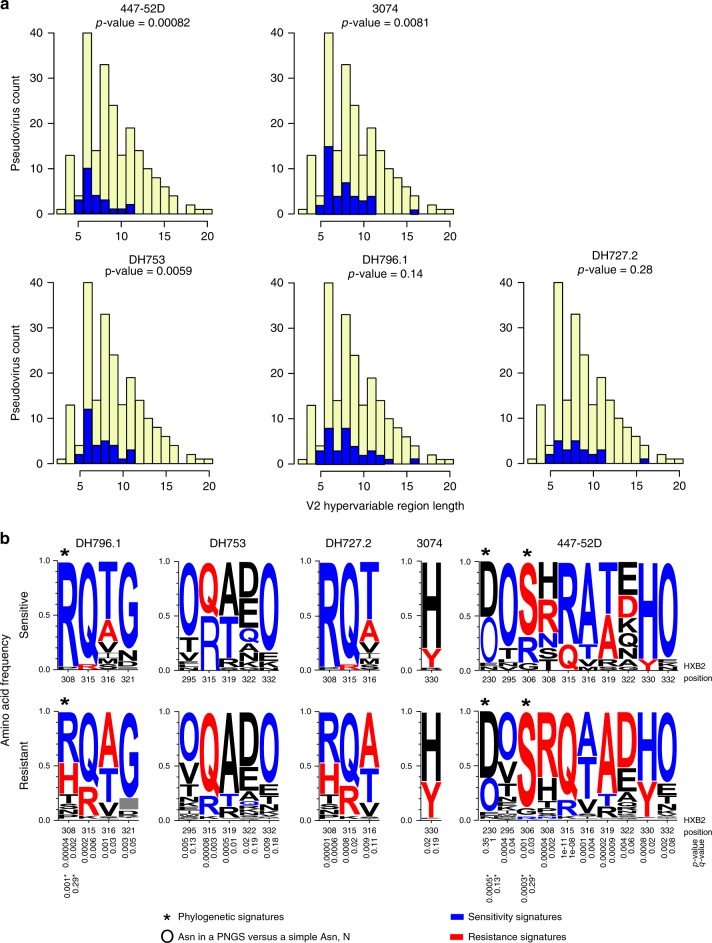
Fig. 4.
Signatures of V3 region-specific neutralization sensitivity. a V2 region length was associated with V3 antibody neutralization sensitivity. Bar graphs display the number of viruses with a given V2 hypervariable region length, and the colors indicate antibody neutralization resistance (yellow) and sensitivity (blue). Viruses were divided into two groups: a group with V2 lengths above 8 amino acids (the median) and a group with V2 lengths at the median or below. A Fisher’s exact test was used to compare the frequency of positive IC50 values in each group. P-values of < 0.006 withstand a Bonferroni correction (n = 47 viruses for DH727.2, n = 48 viruses for DH753, n = 77 viruses for DH796.1, n = 55 viruses for 3074, n = 24 viruses for 447–52D). Associations were significant for 447–52D and DH753. b Env signature patterns associated with V3 antibody neutralization. Sequence LOGOs show the frequency of amino acids at signature positions in the groups of viruses (n = 292) with detectable (sensitive) or undetectable (> 50 µg mL‒1; resistant) IC50 scores. Signature analysis was phylogenetically corrected and used an inclusive q-value cutoff to not miss signal. The 3 identified sites are indicated by asterisks. The p and q-values for these signatures are noted near the bottom of the figure, and are also indicated by an asterisk. We then used simple correlation analysis, and focused on identifying signatures in V3 region as they are most likely to be relevant by virtue of being in the contact region; sites included have a q-value < 0.2 and are in the V3 loop or are the glycosylation sites that frame it at positions 295 and 332 are included. The statistical support for these sites is noted just beneath the resistance LOGOs. “O” is indicative of an N in a glycosylation motif. Blue indicates amino acids in sites associated with sensitivity, red with resistance, and black was not significantly associated with either. Source data are provided as a Source Data file and Supplementary Data 1

