
Fig. 3.
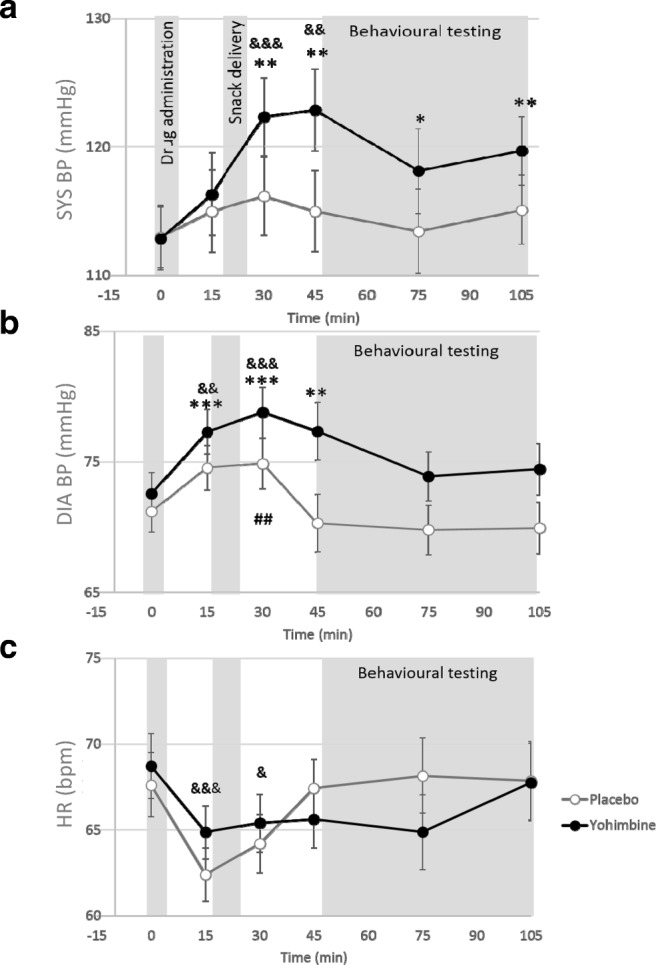
Measurements of a systolic blood pressure, b diastolic blood pressure and c heart rate of the yohimbine and placebo groups across the session. Error bars represent standard error. Significant difference from baseline: *p < .05, **p < .01, ***p < .001 (yohimbine group); ##p < .01 (placebo group); &p < .05, &&p < .01, &&&p < .001 (main effect of time)