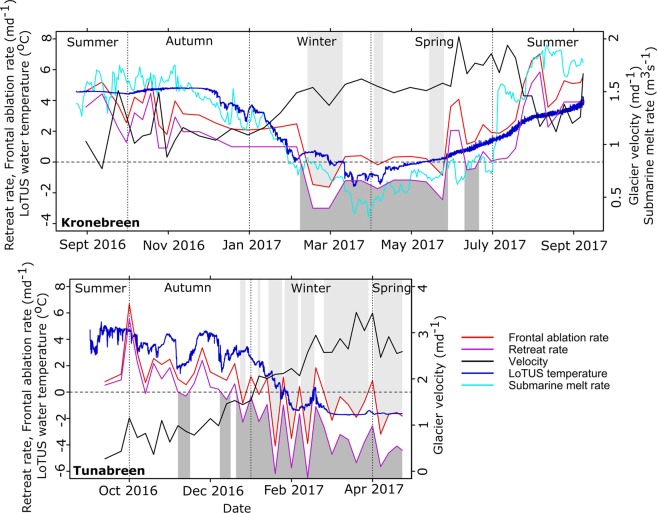
Figure 3.
The frontal ablation rate, and its constituent variables retreat rate and velocity, are shown for both Kronebreen (top) and Tunabreen (bottom). The light grey areas highlight areas of ‘frontal accumulation’, as calculated by Eq. 1, and the dark grey areas highlight areas of margin advance. Additionally, the water temperature at depth from the LoTUS buoys in each fjord, and the calculated submarine melt rate for Kronebreen are shown. The plots have different scales, but share the same horizontal axis. Plots created in R36.

